The Problem:
Our business stakeholders wanted to create a product that leveraged available student data to inform the actions of academic administrators, students, and faculty. The product had to address the needs of a diverse set of unique user types, and also present relevant data in a way that was both accessible and actionable.
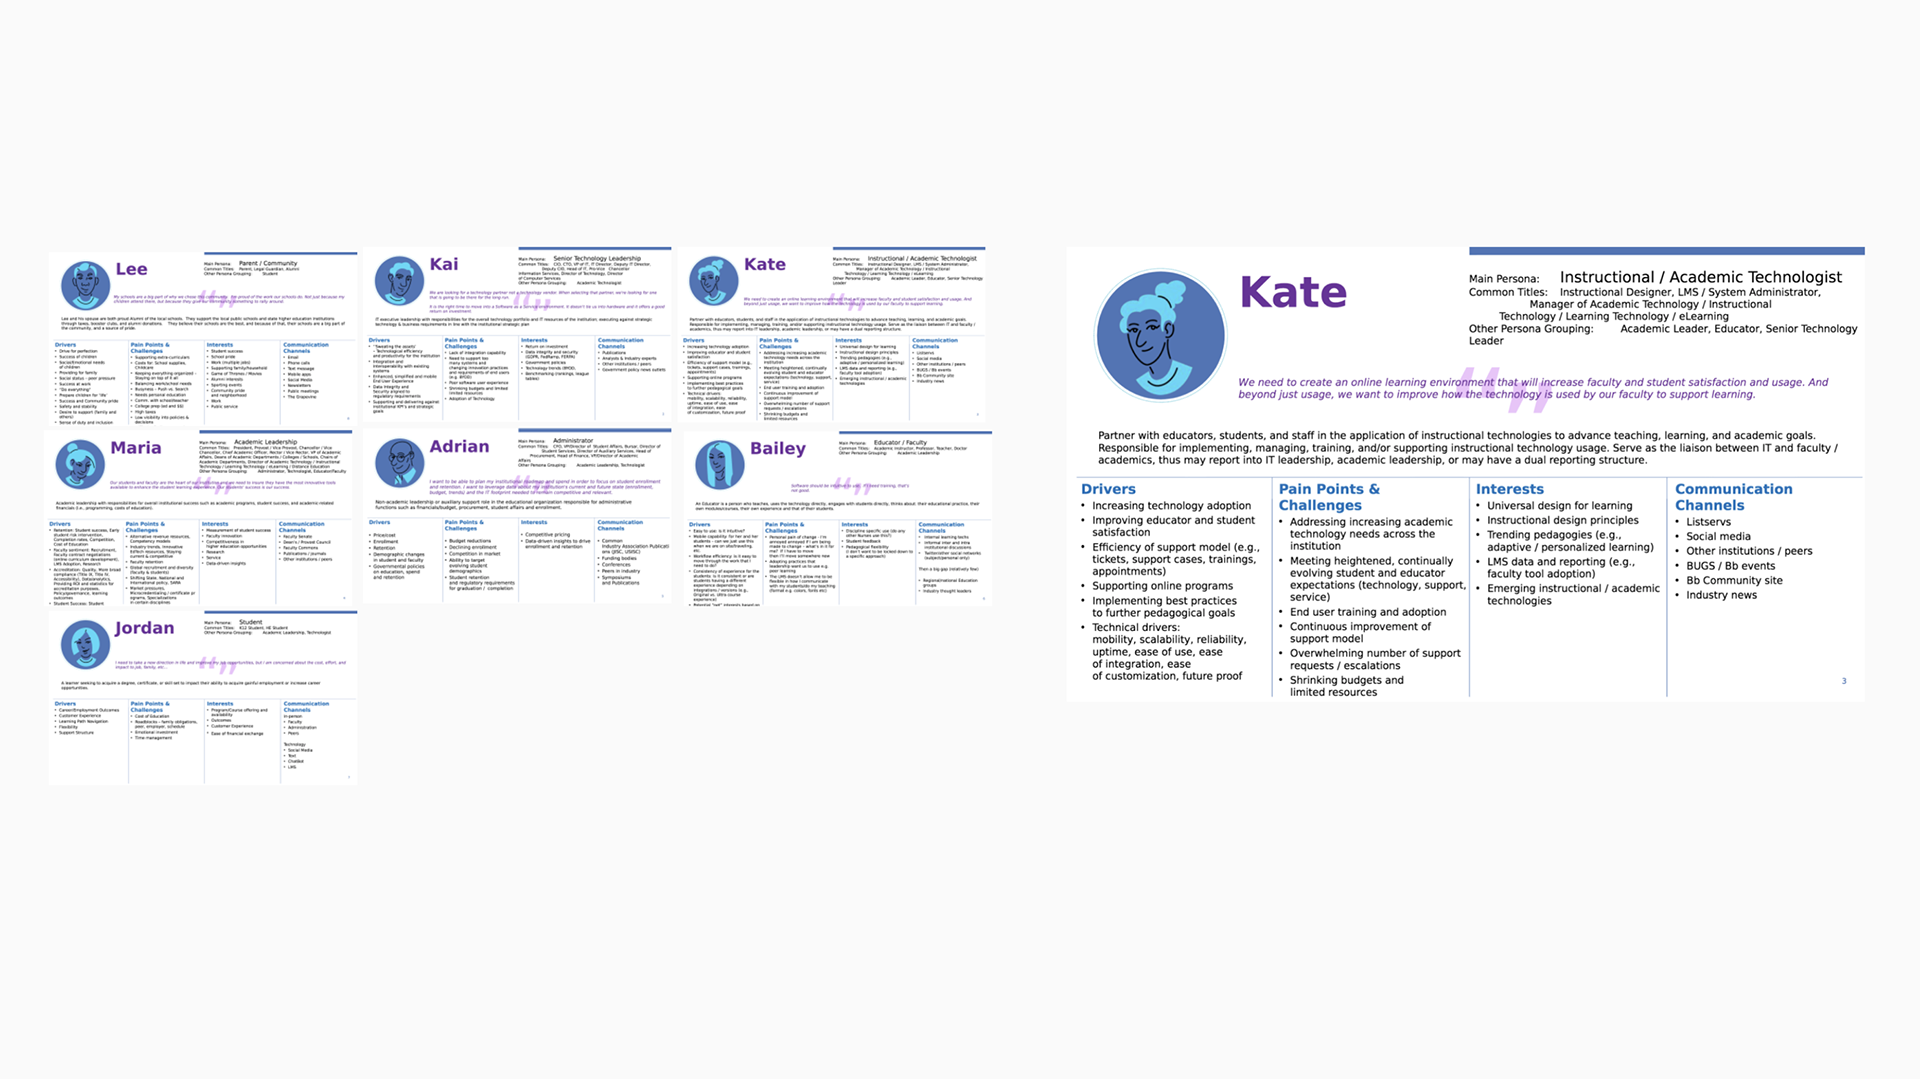
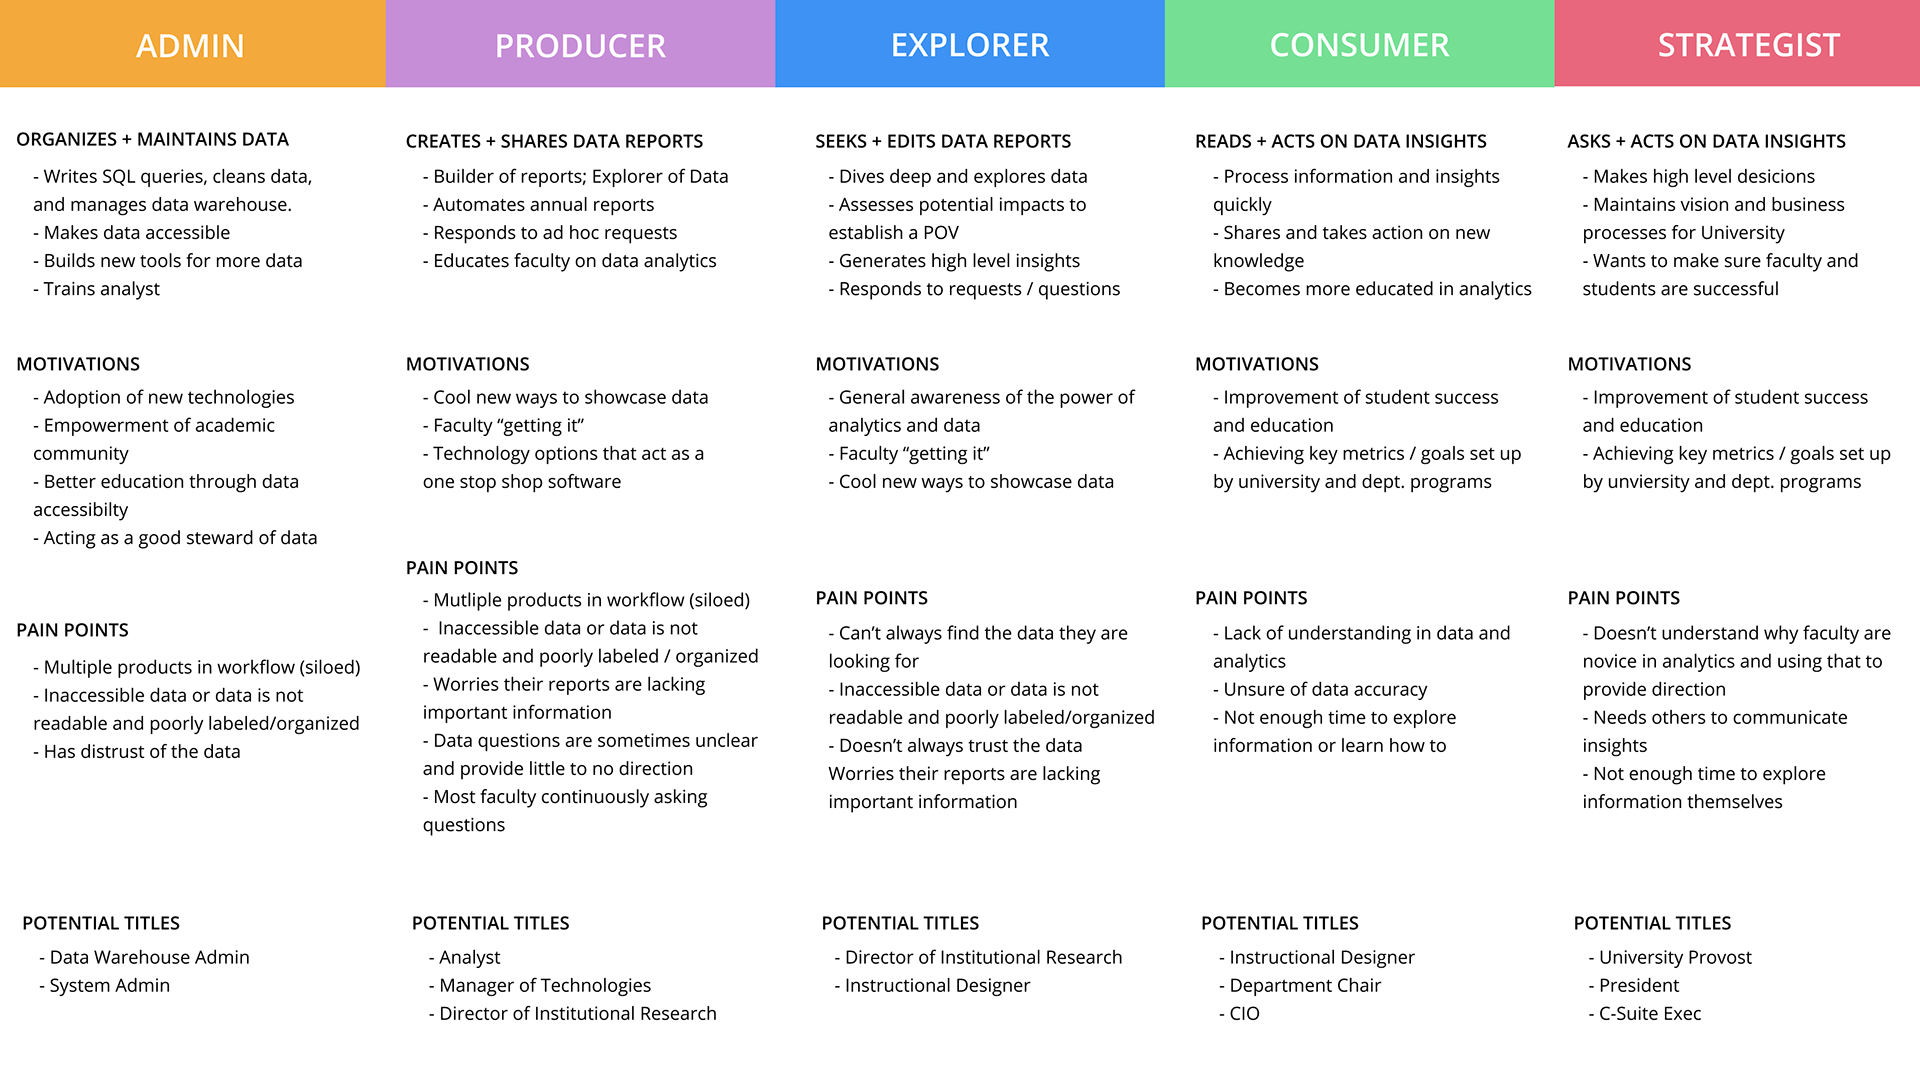
Understanding the Problem:
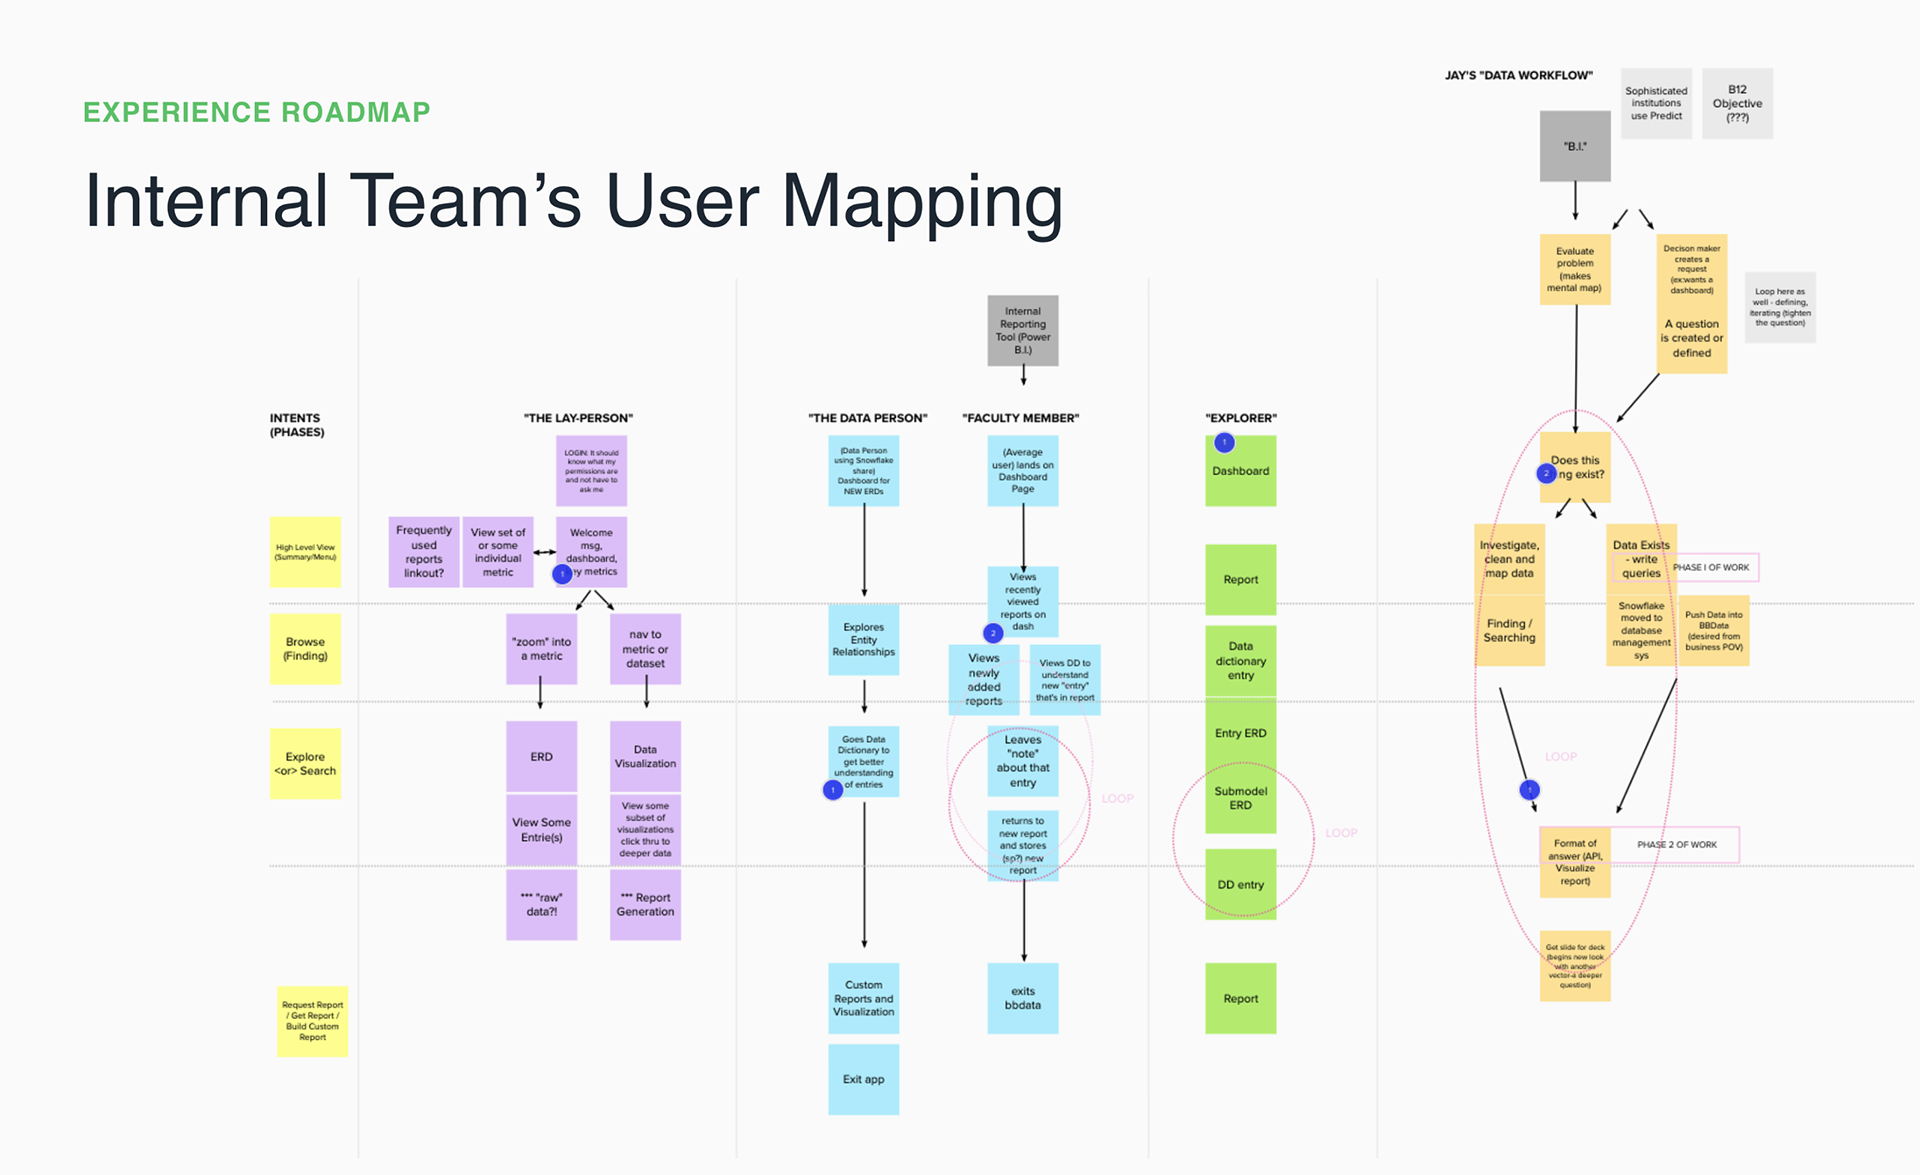
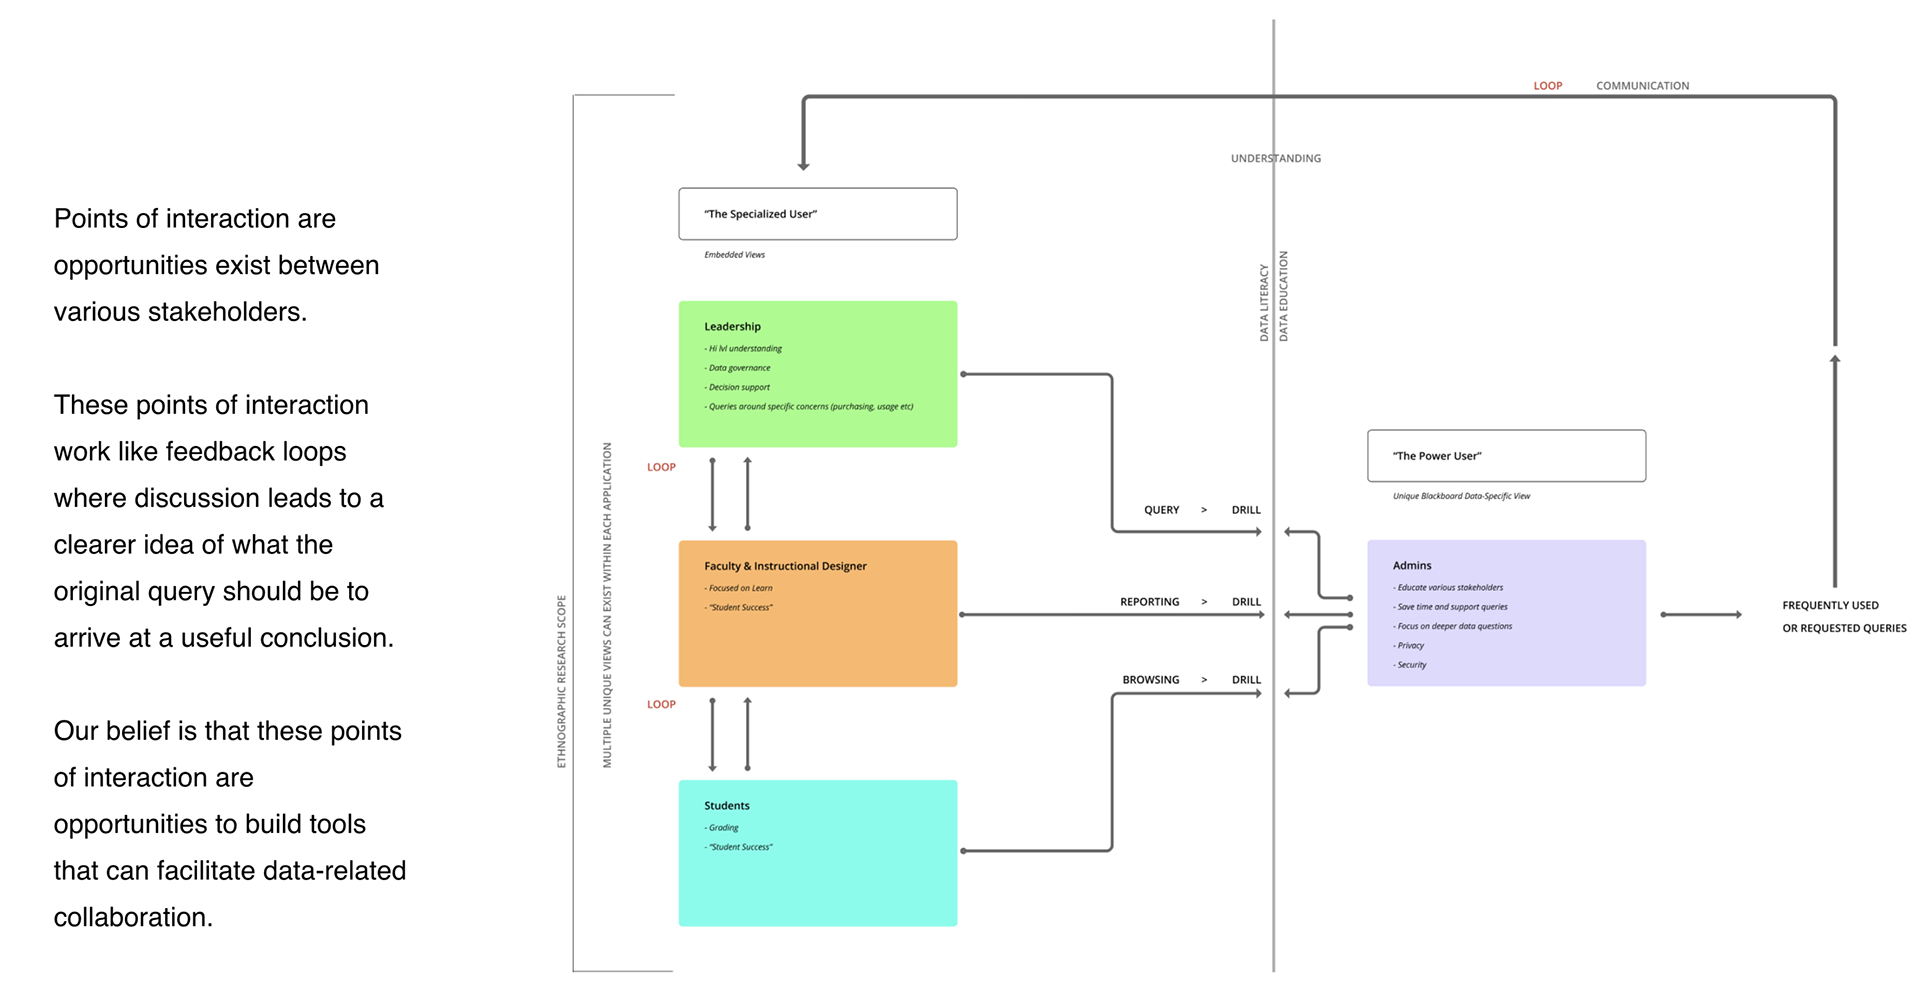
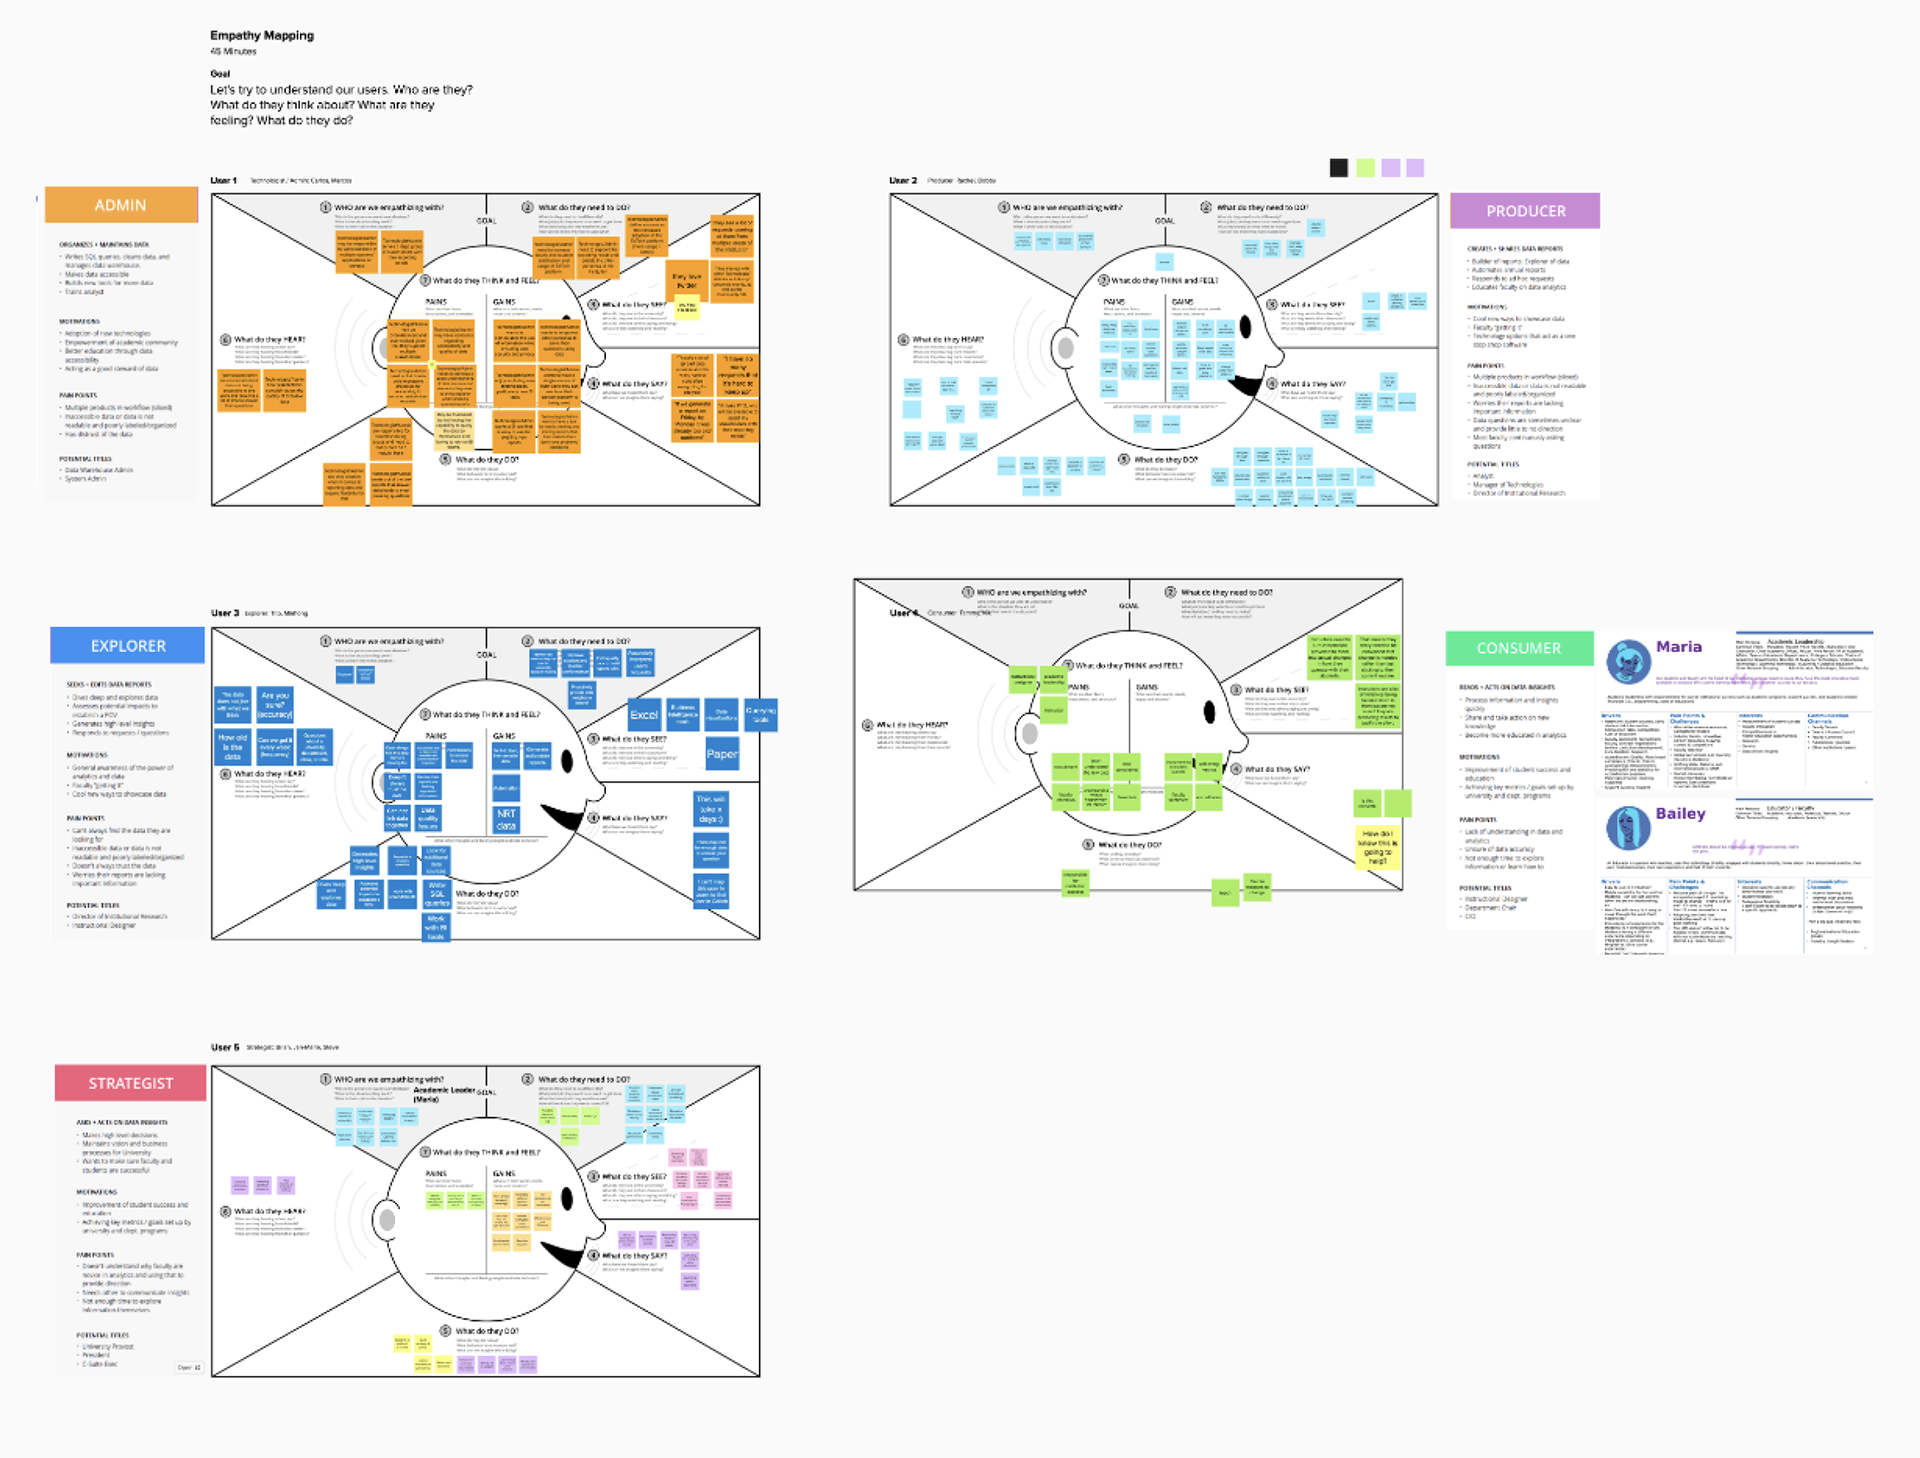
The research team had created a set of behavioral persona as a starting point. The organization also had a set of more traditional, marketing personas that were then folded into that set of personas. We were then able to synthesize these user groups into a a spectrum of behavioral persona - this ranged from very data-science fluent data miners to individuals looking for specific data insights to support, and leaders simply looking for high level insights to support decision making.
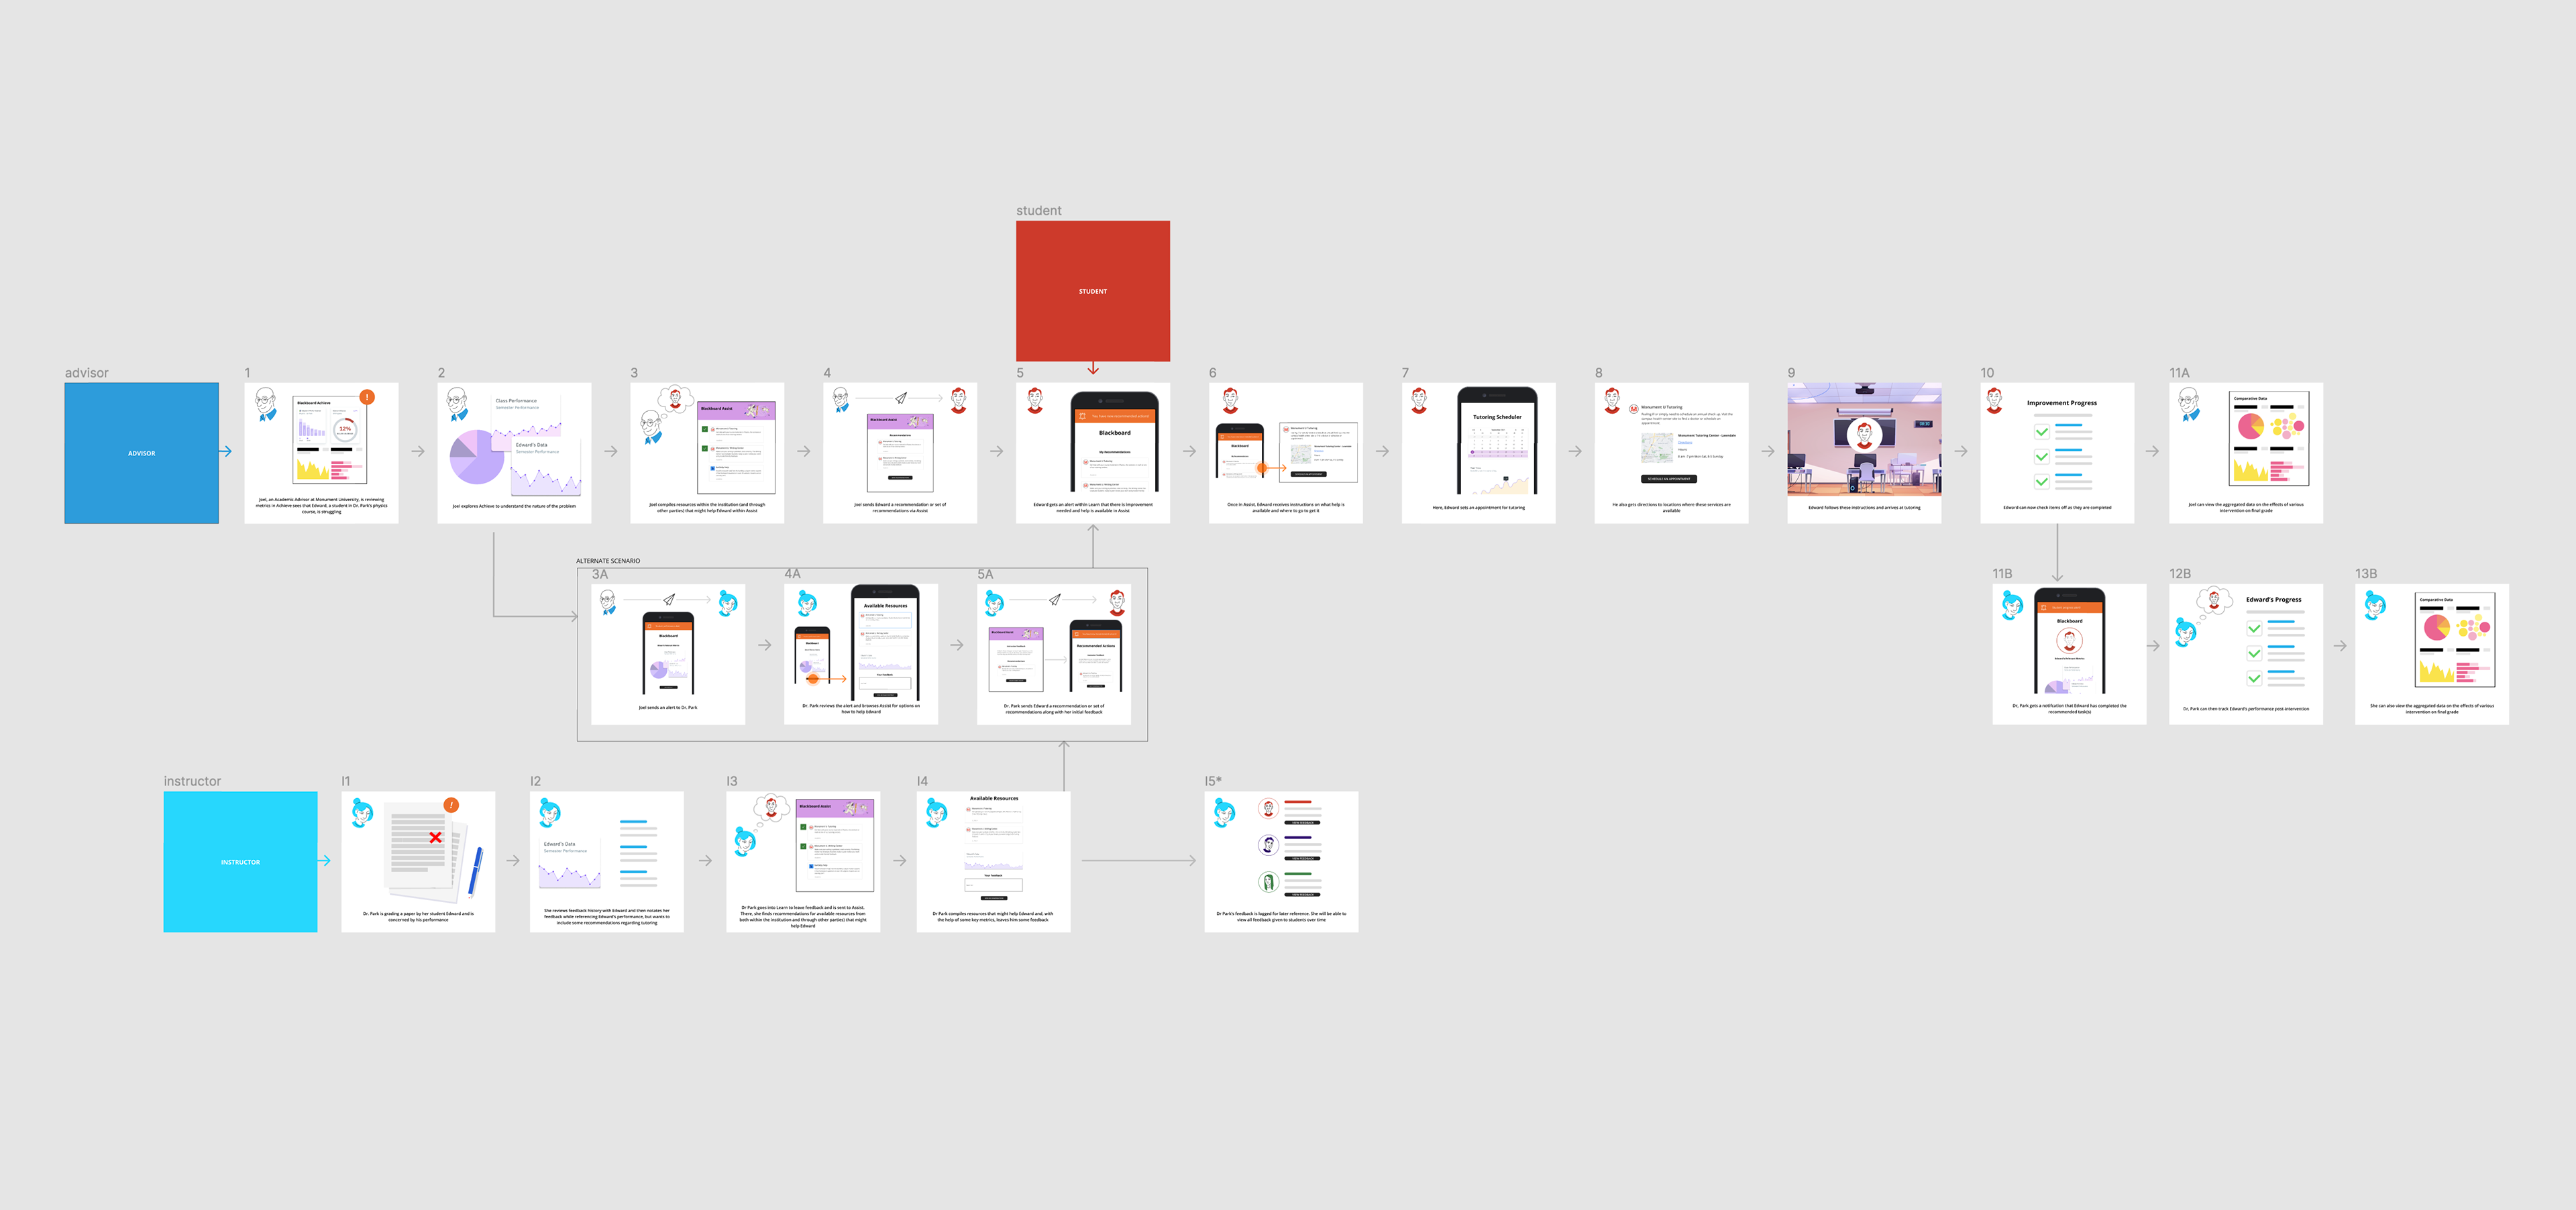
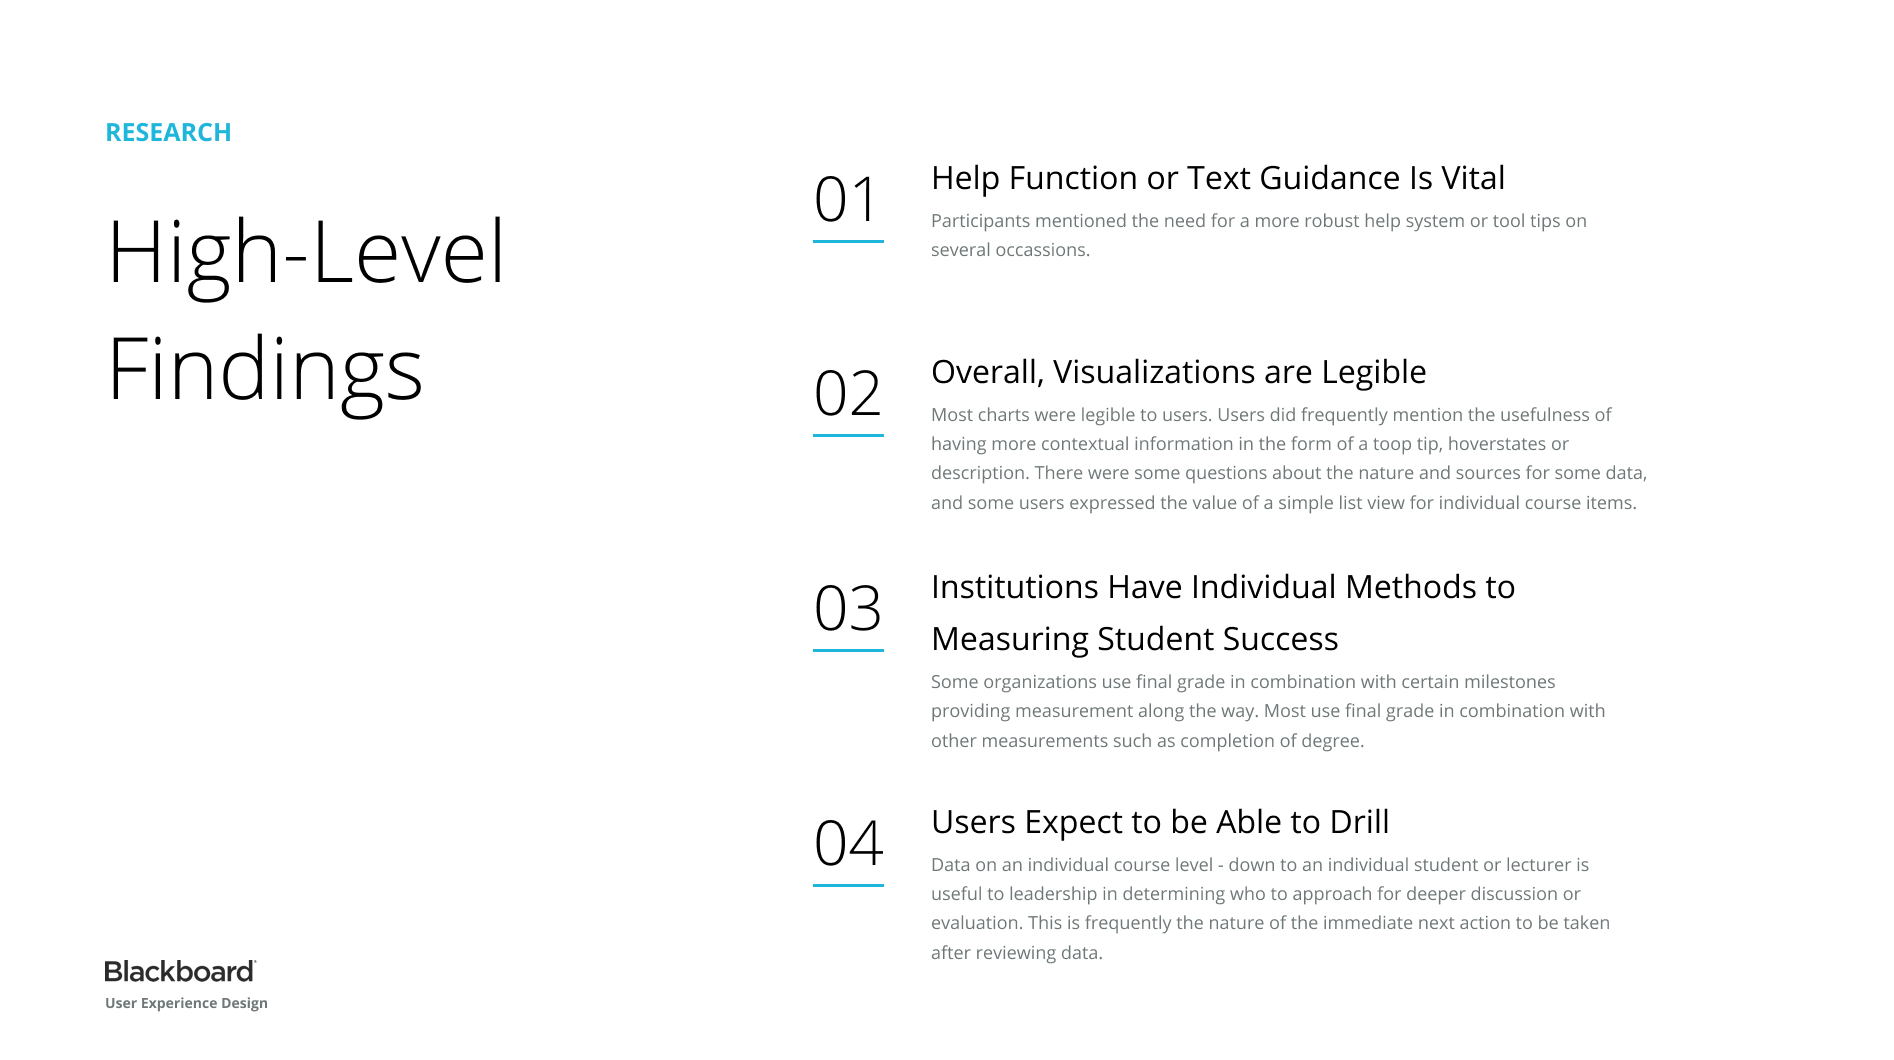
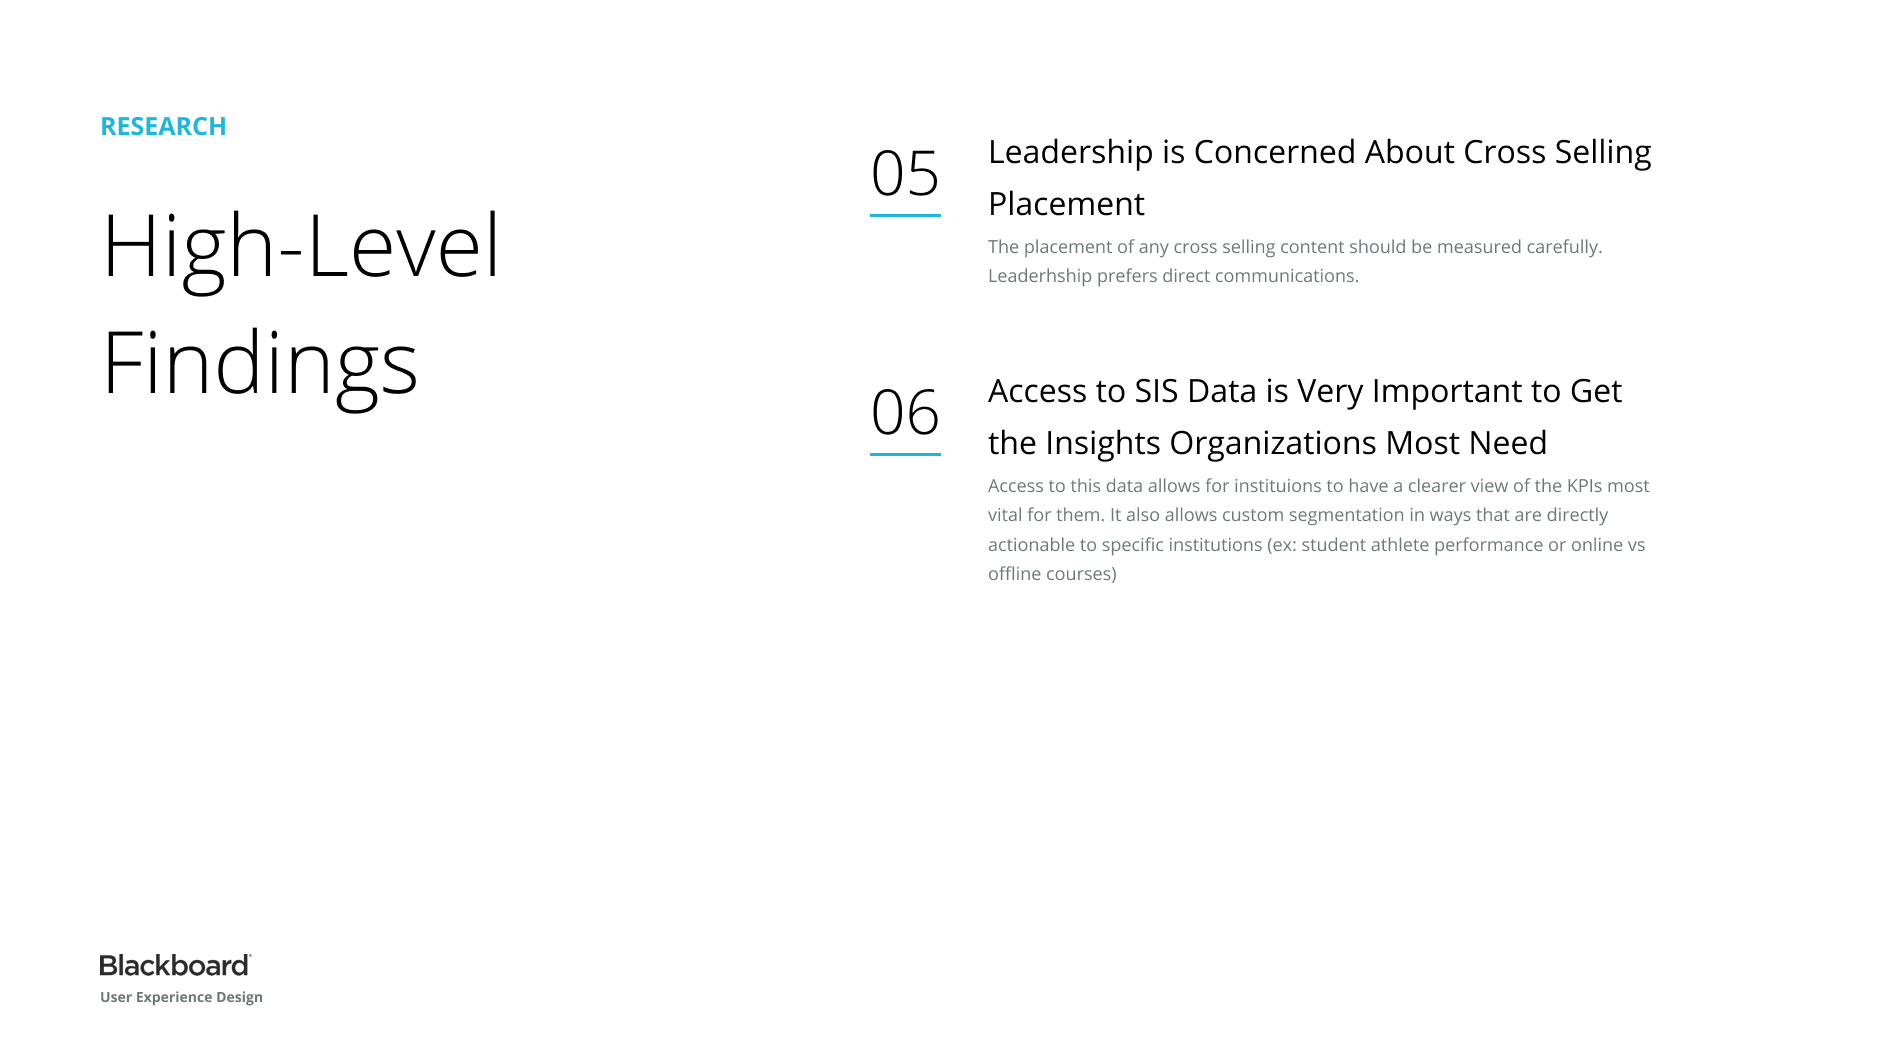
The Research:
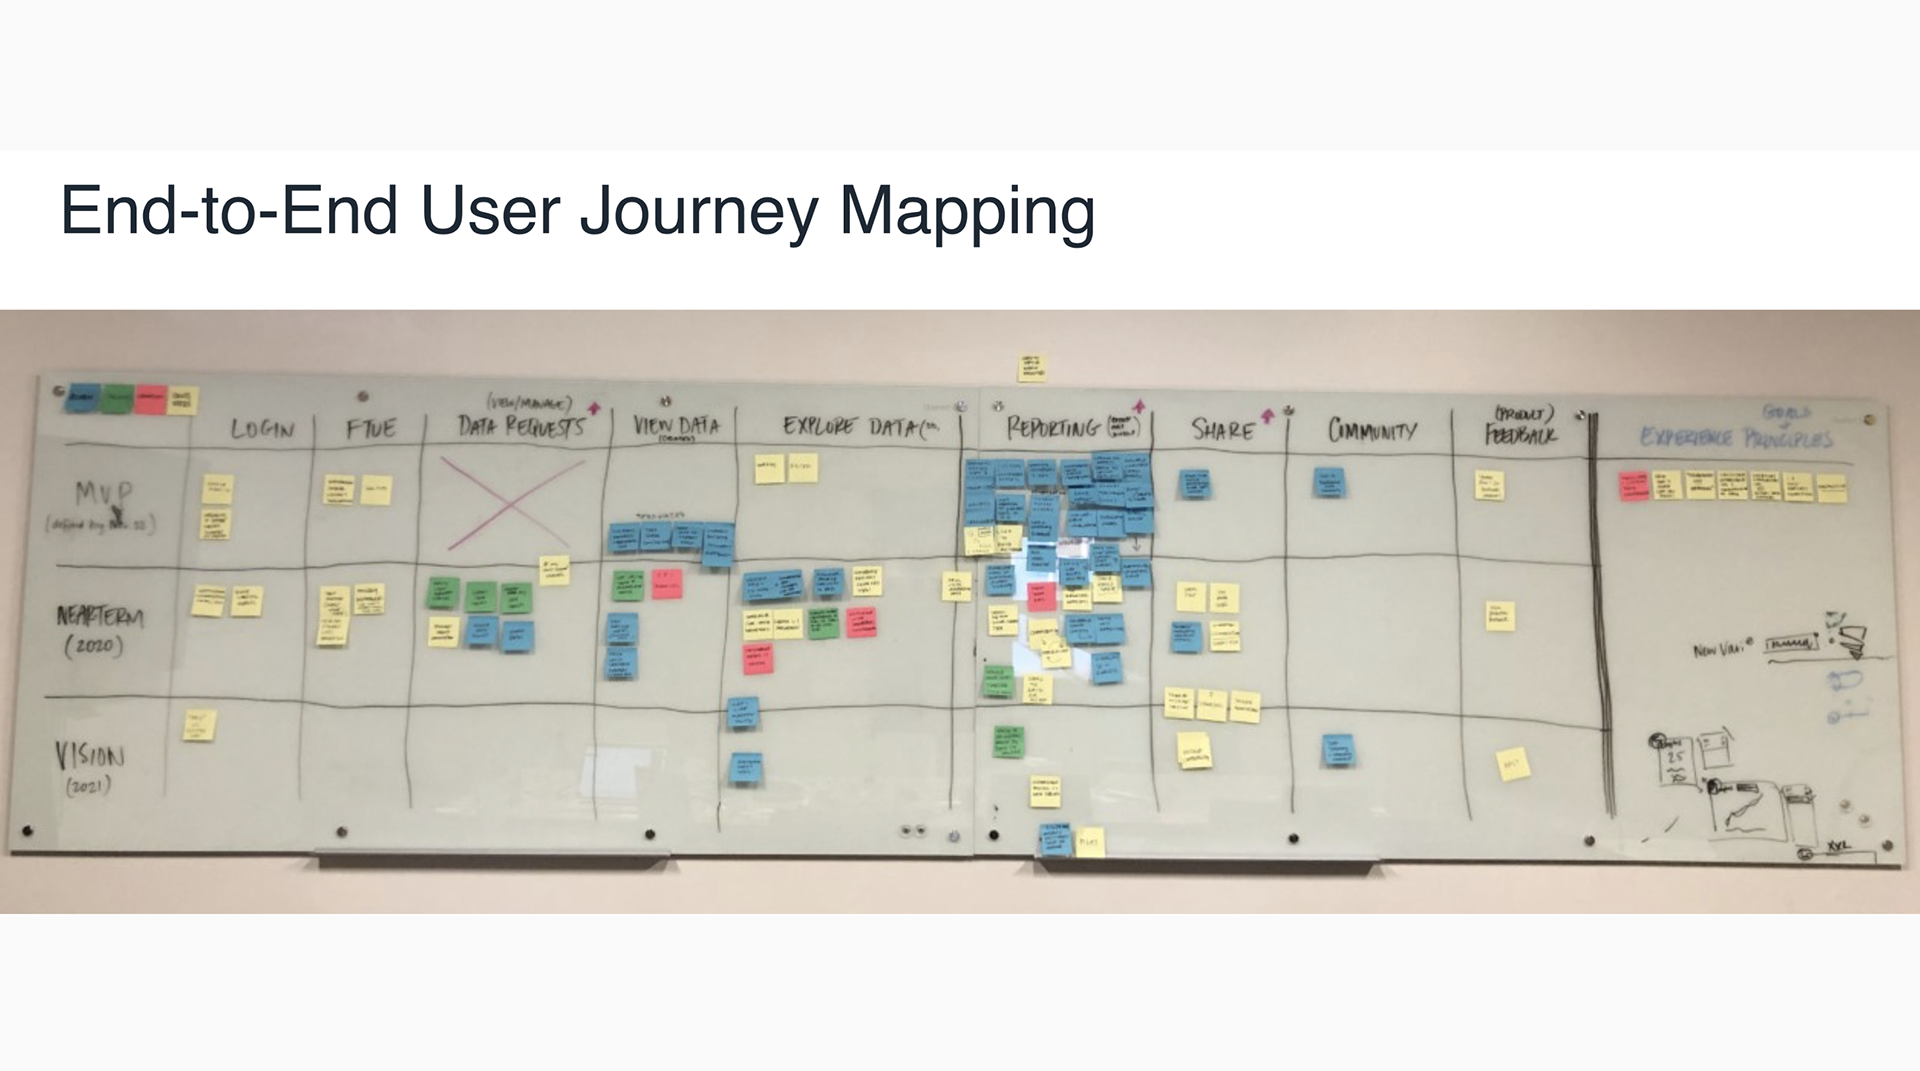
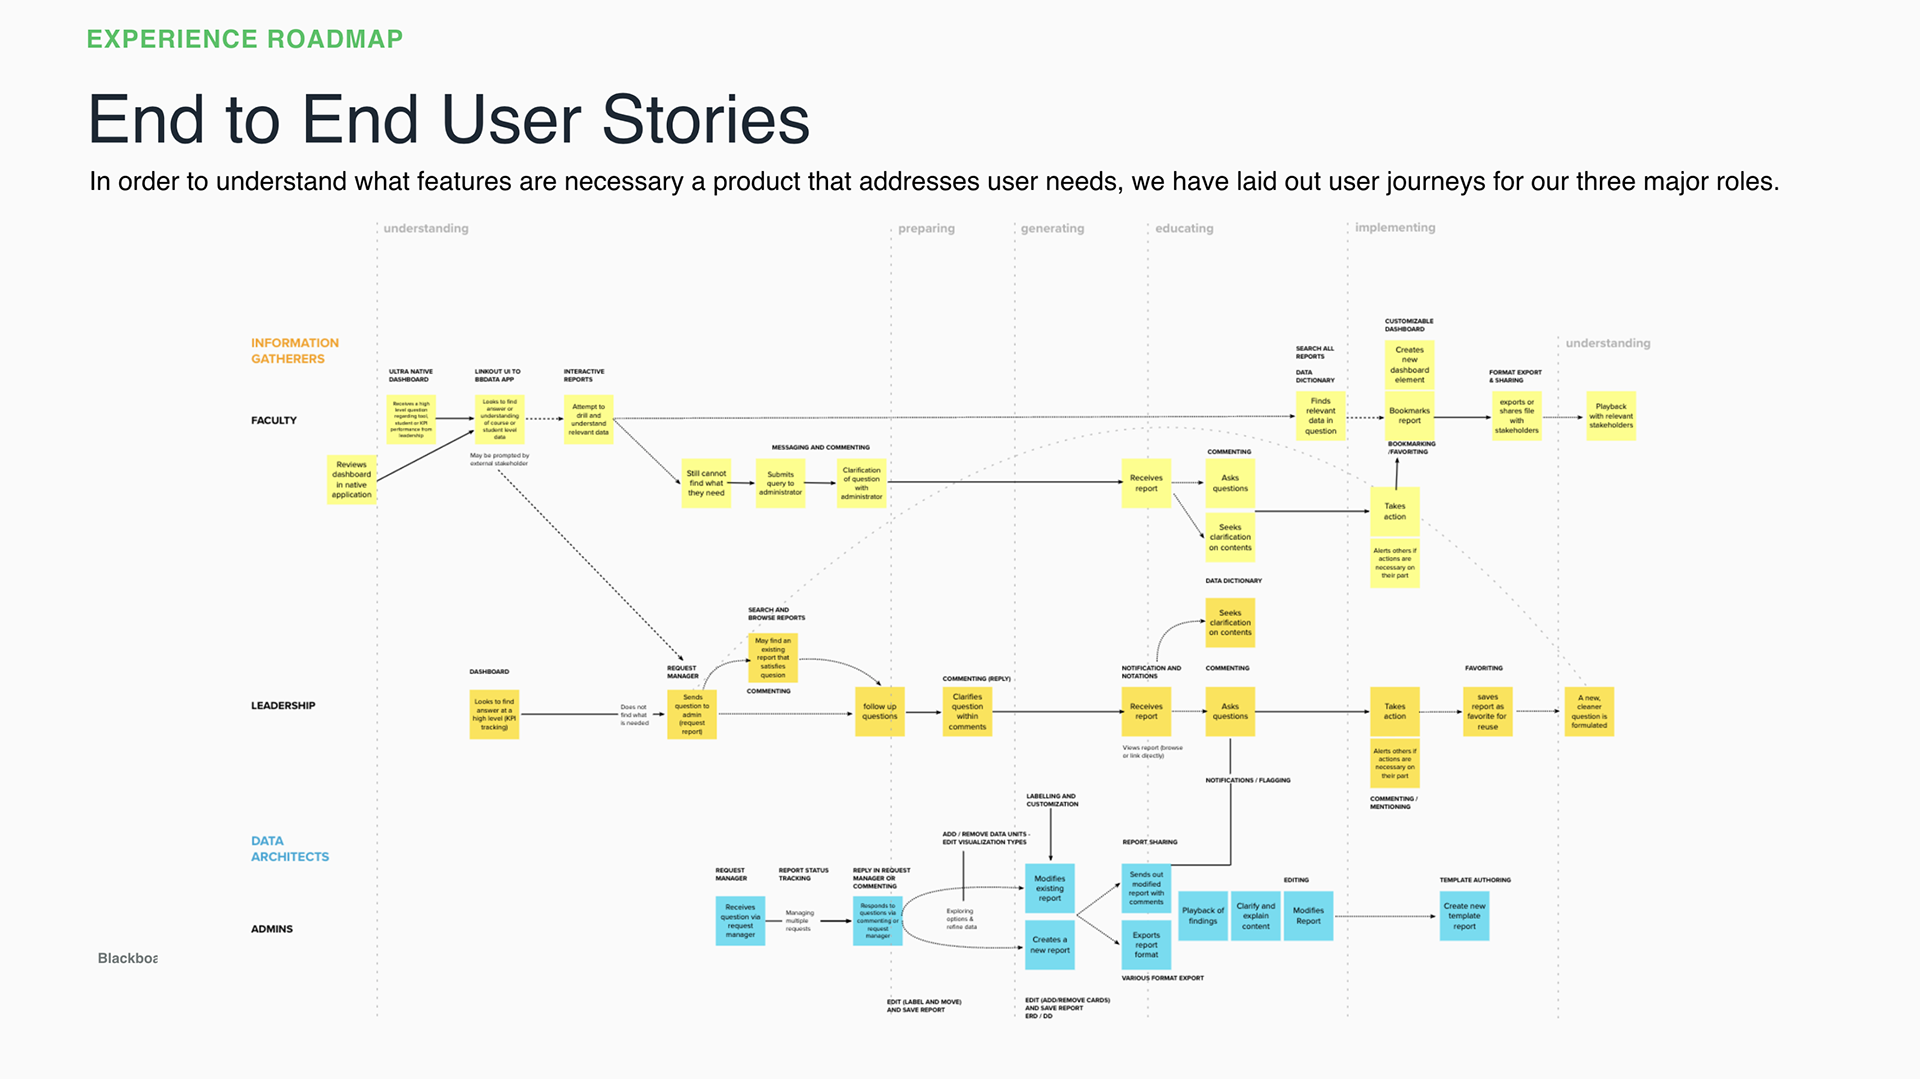
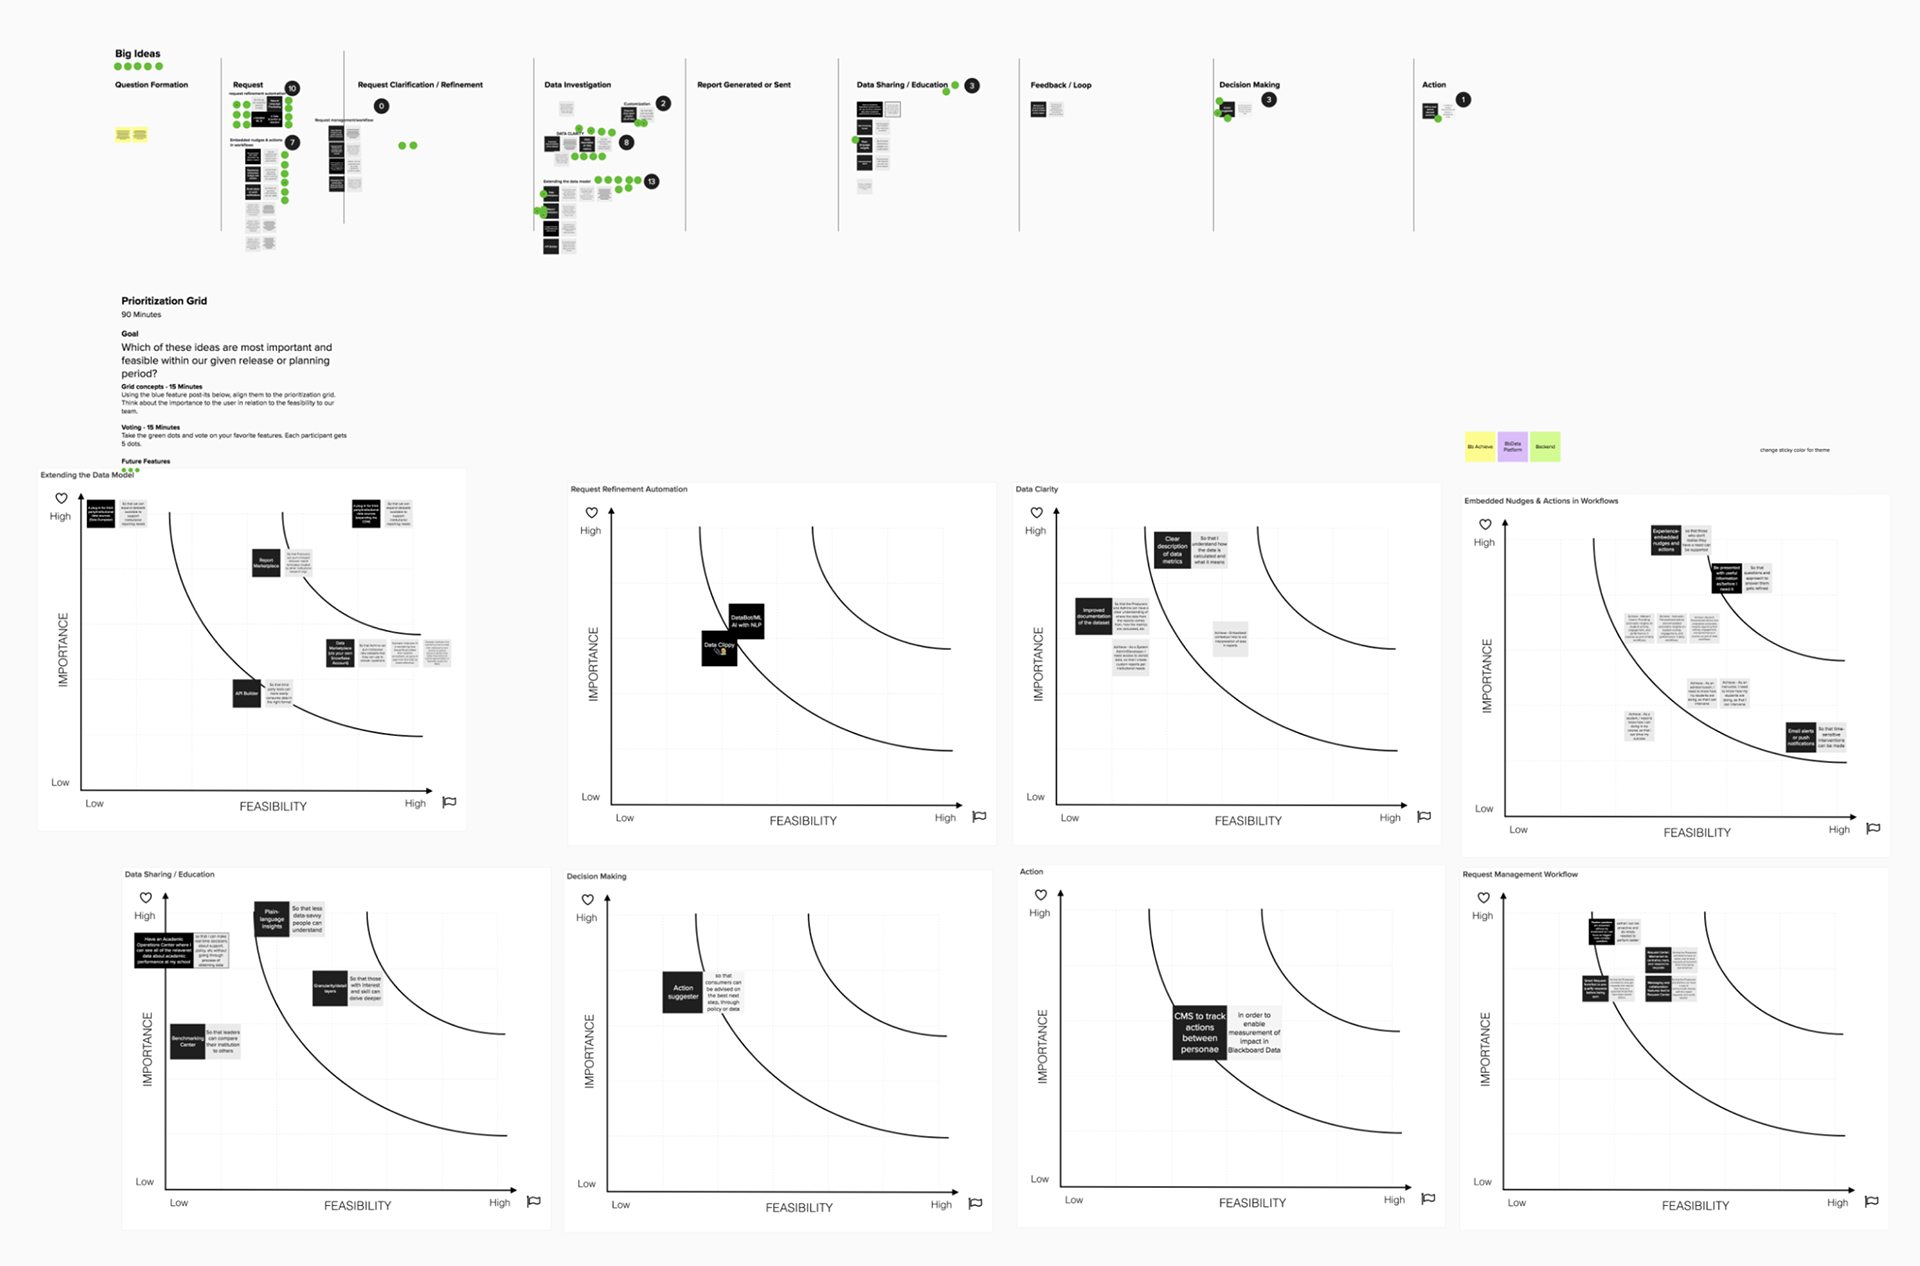
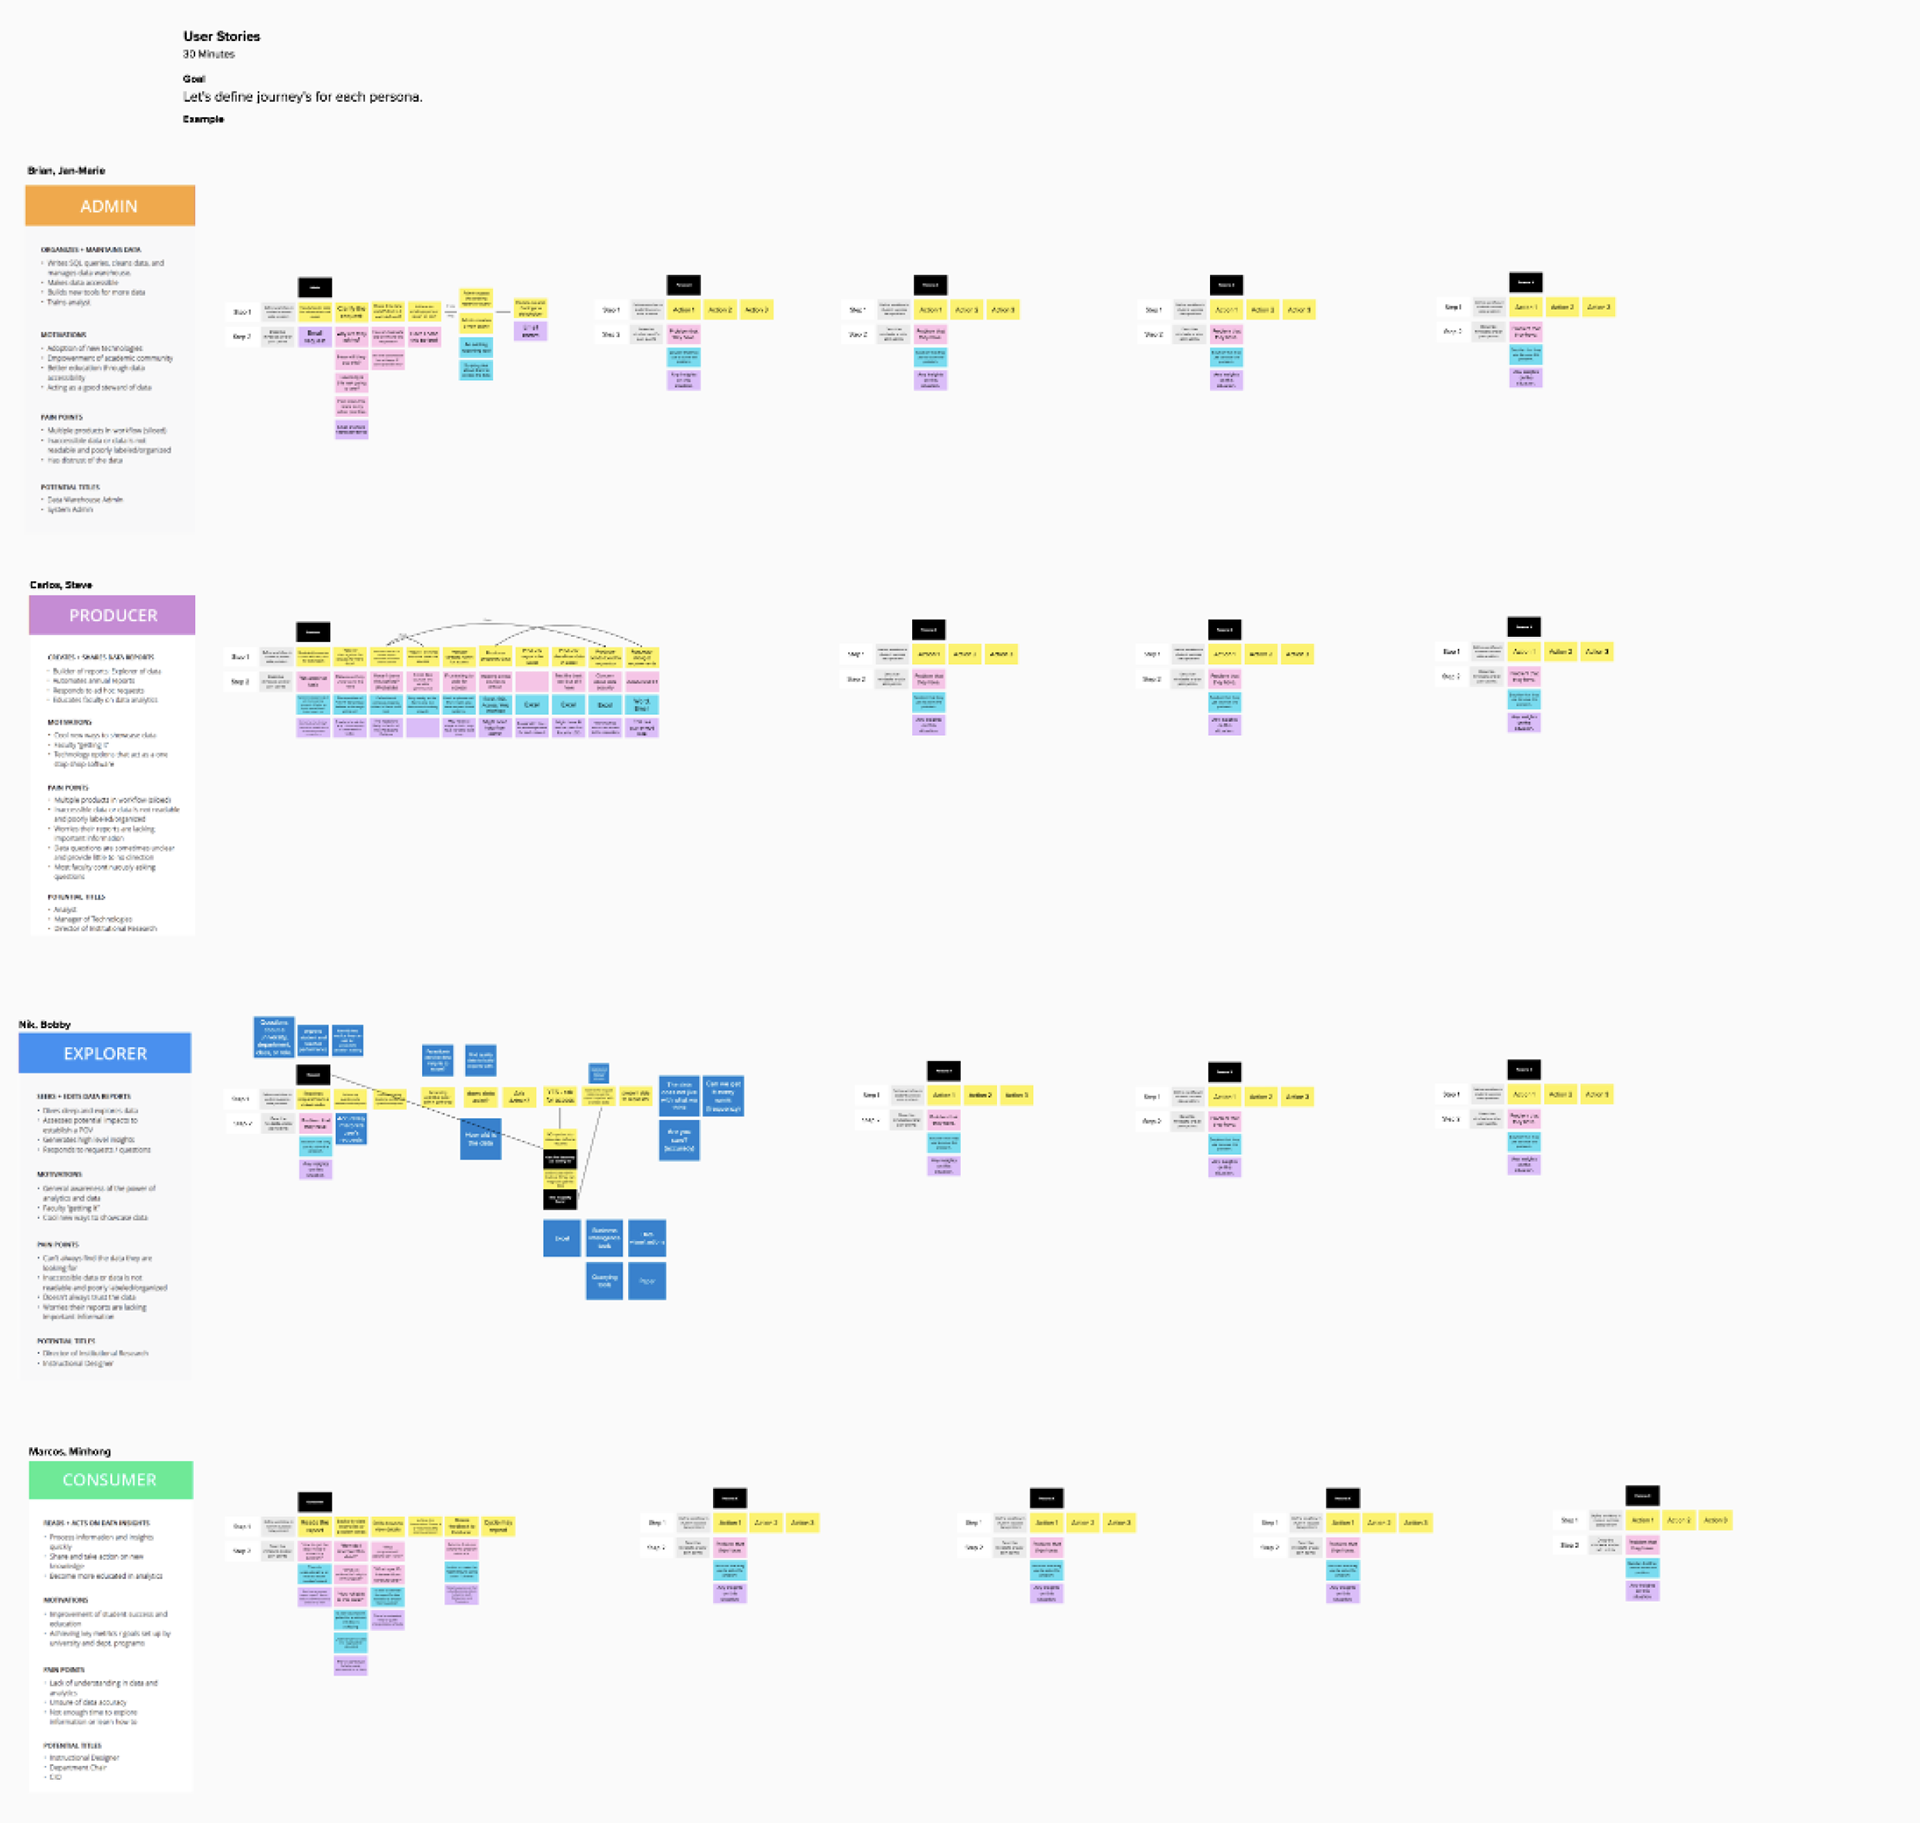
There were clear unknowns that remained, and we wanted to evaluate the accuracy of the user needs we had merged. So, we did a round of both remote and in-person contextual inquiry to in the gaps. These learnings allowed us to iterate on our persona information and generate an end-to-end user journey. We then ran workshops to define user stories for the refined persona set. By doing this, we were able to identify and rate priorities using an impact/feasibility scale. We then set out the work in a short/mid/long view.
Recommendations:
One of the things that we realized in our research sprint was the product needed bring data-fluent users and data lay-persons closer together. This was one of the key design pillars that defined the vision and nature of our work moving forward.
Drafting / Concepting:
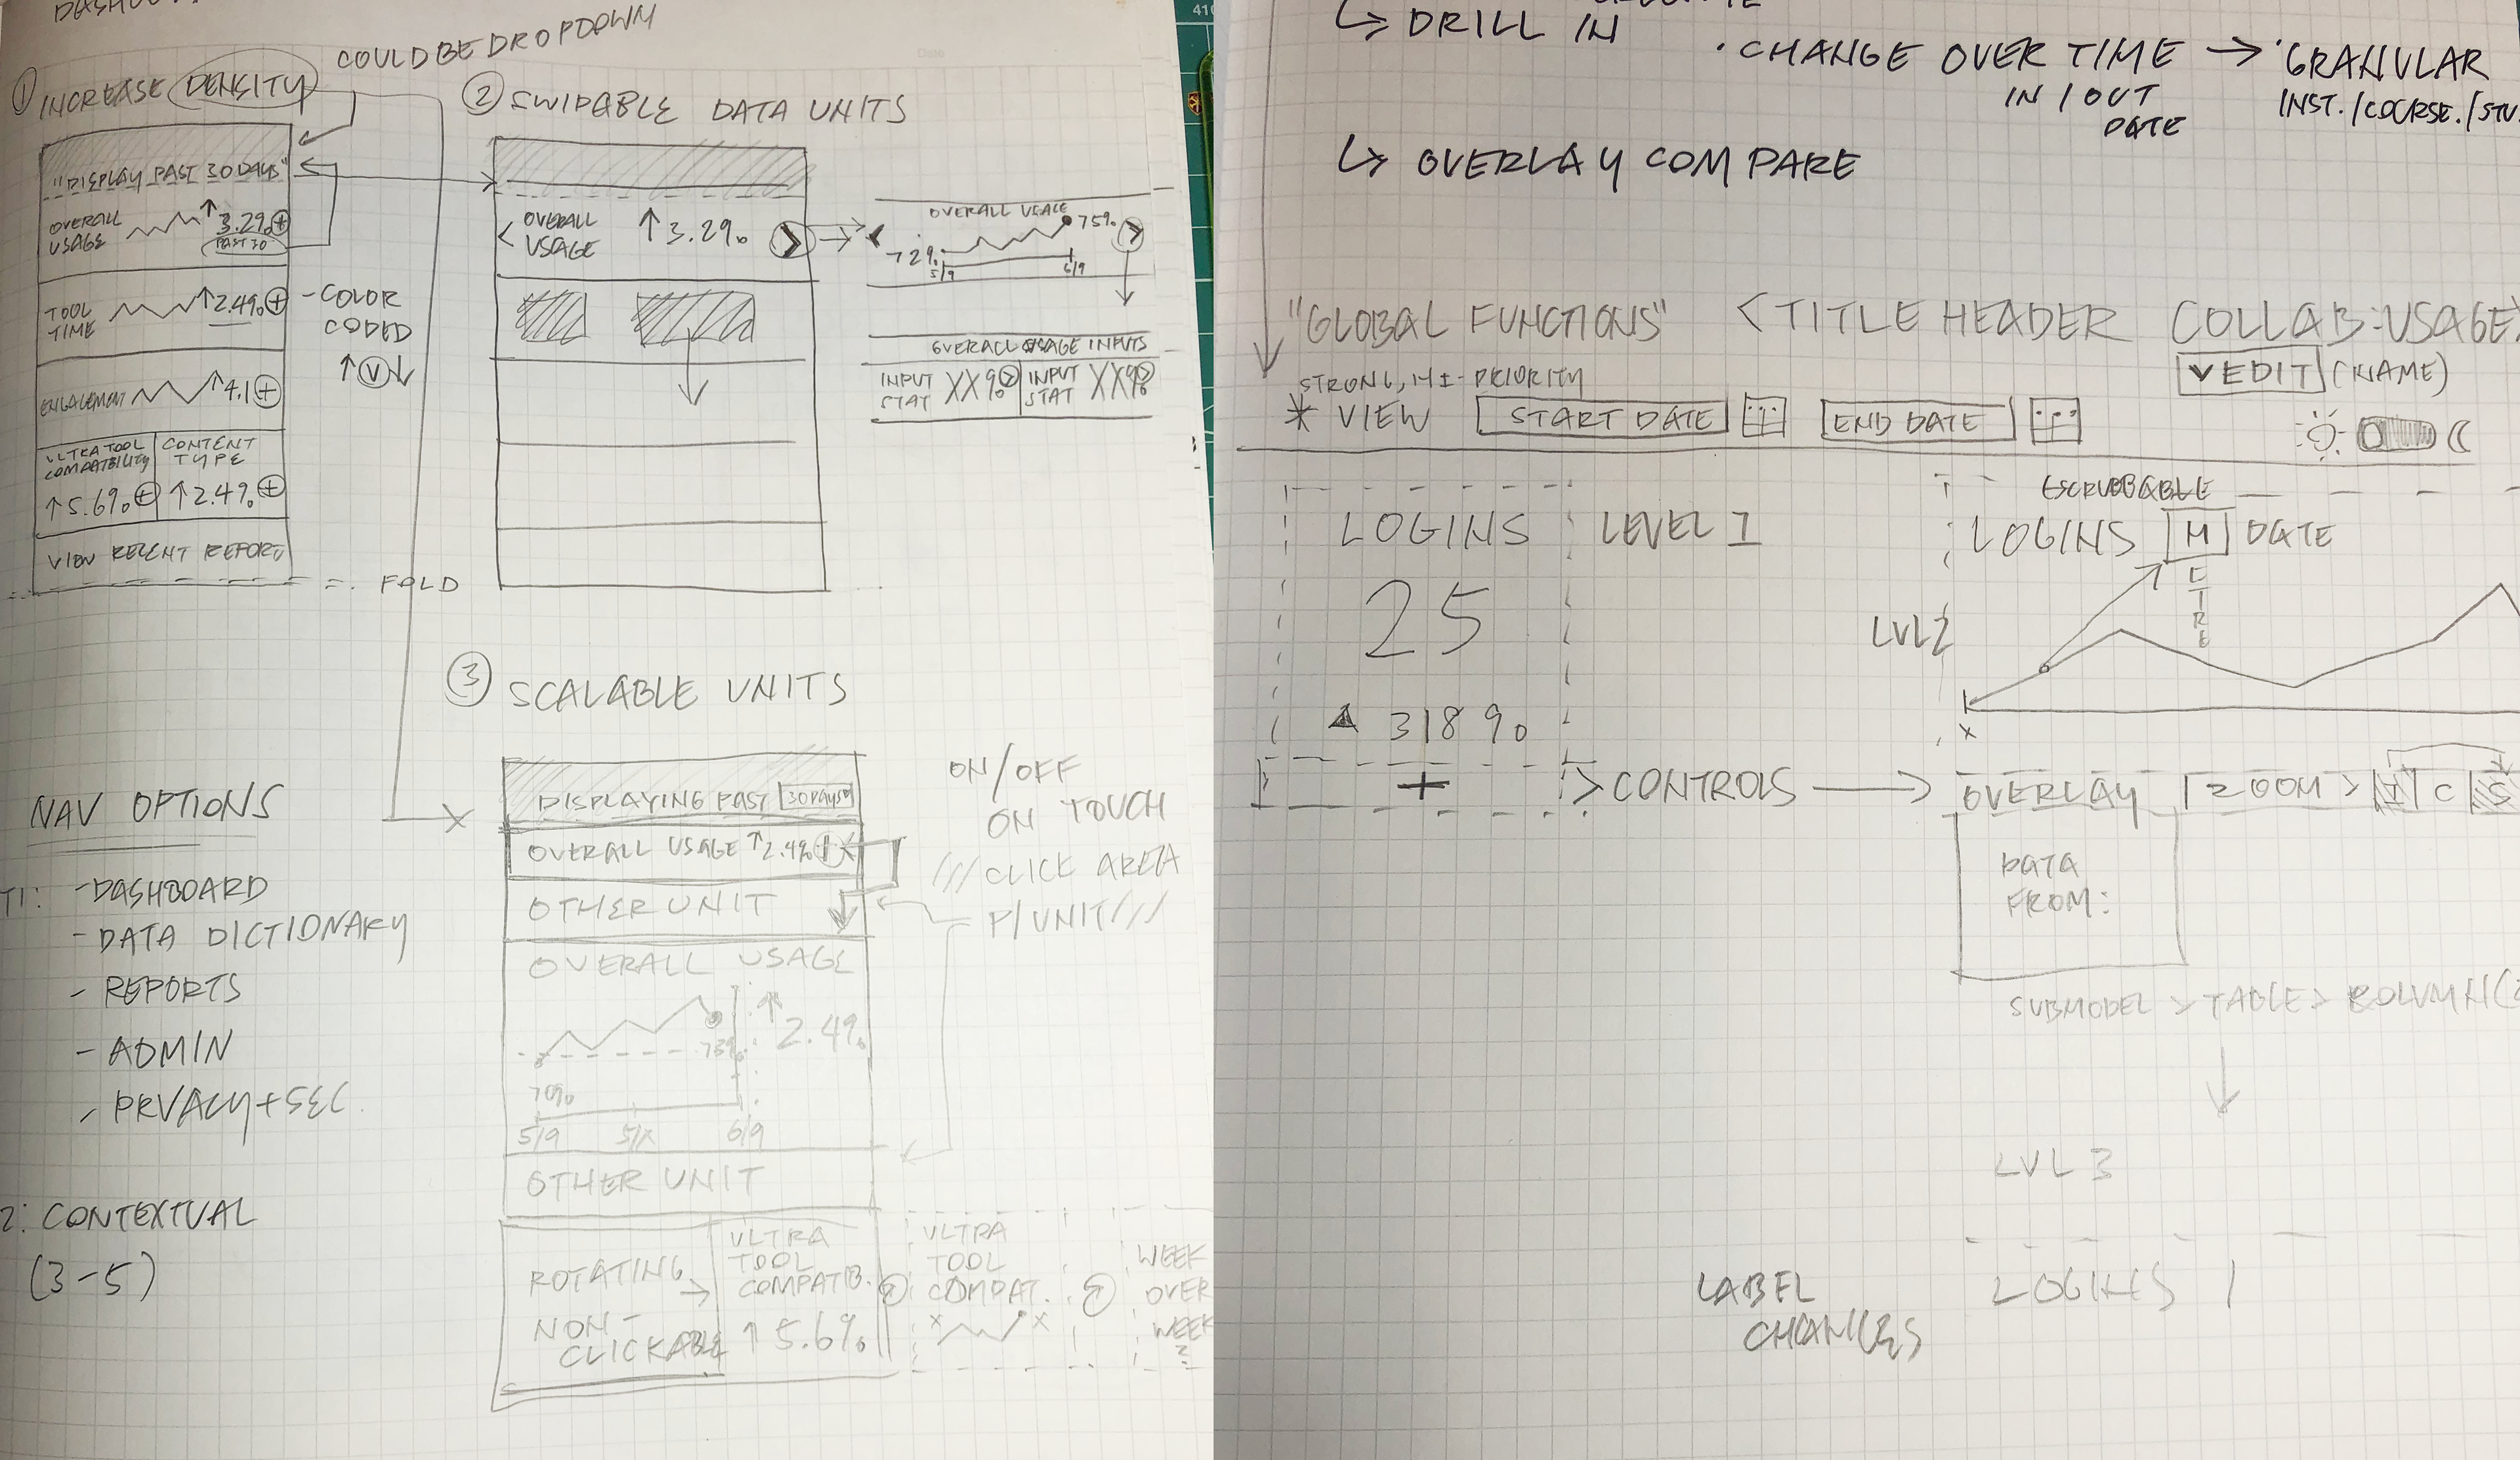
I then worked closely with the data science team to draft a set of concepts that would feature a wide range of visualization methods. Key concerns were around data governance, how to best show comparison data between students vs the larger cohort, and defining the key indicators of an individual's final grade.
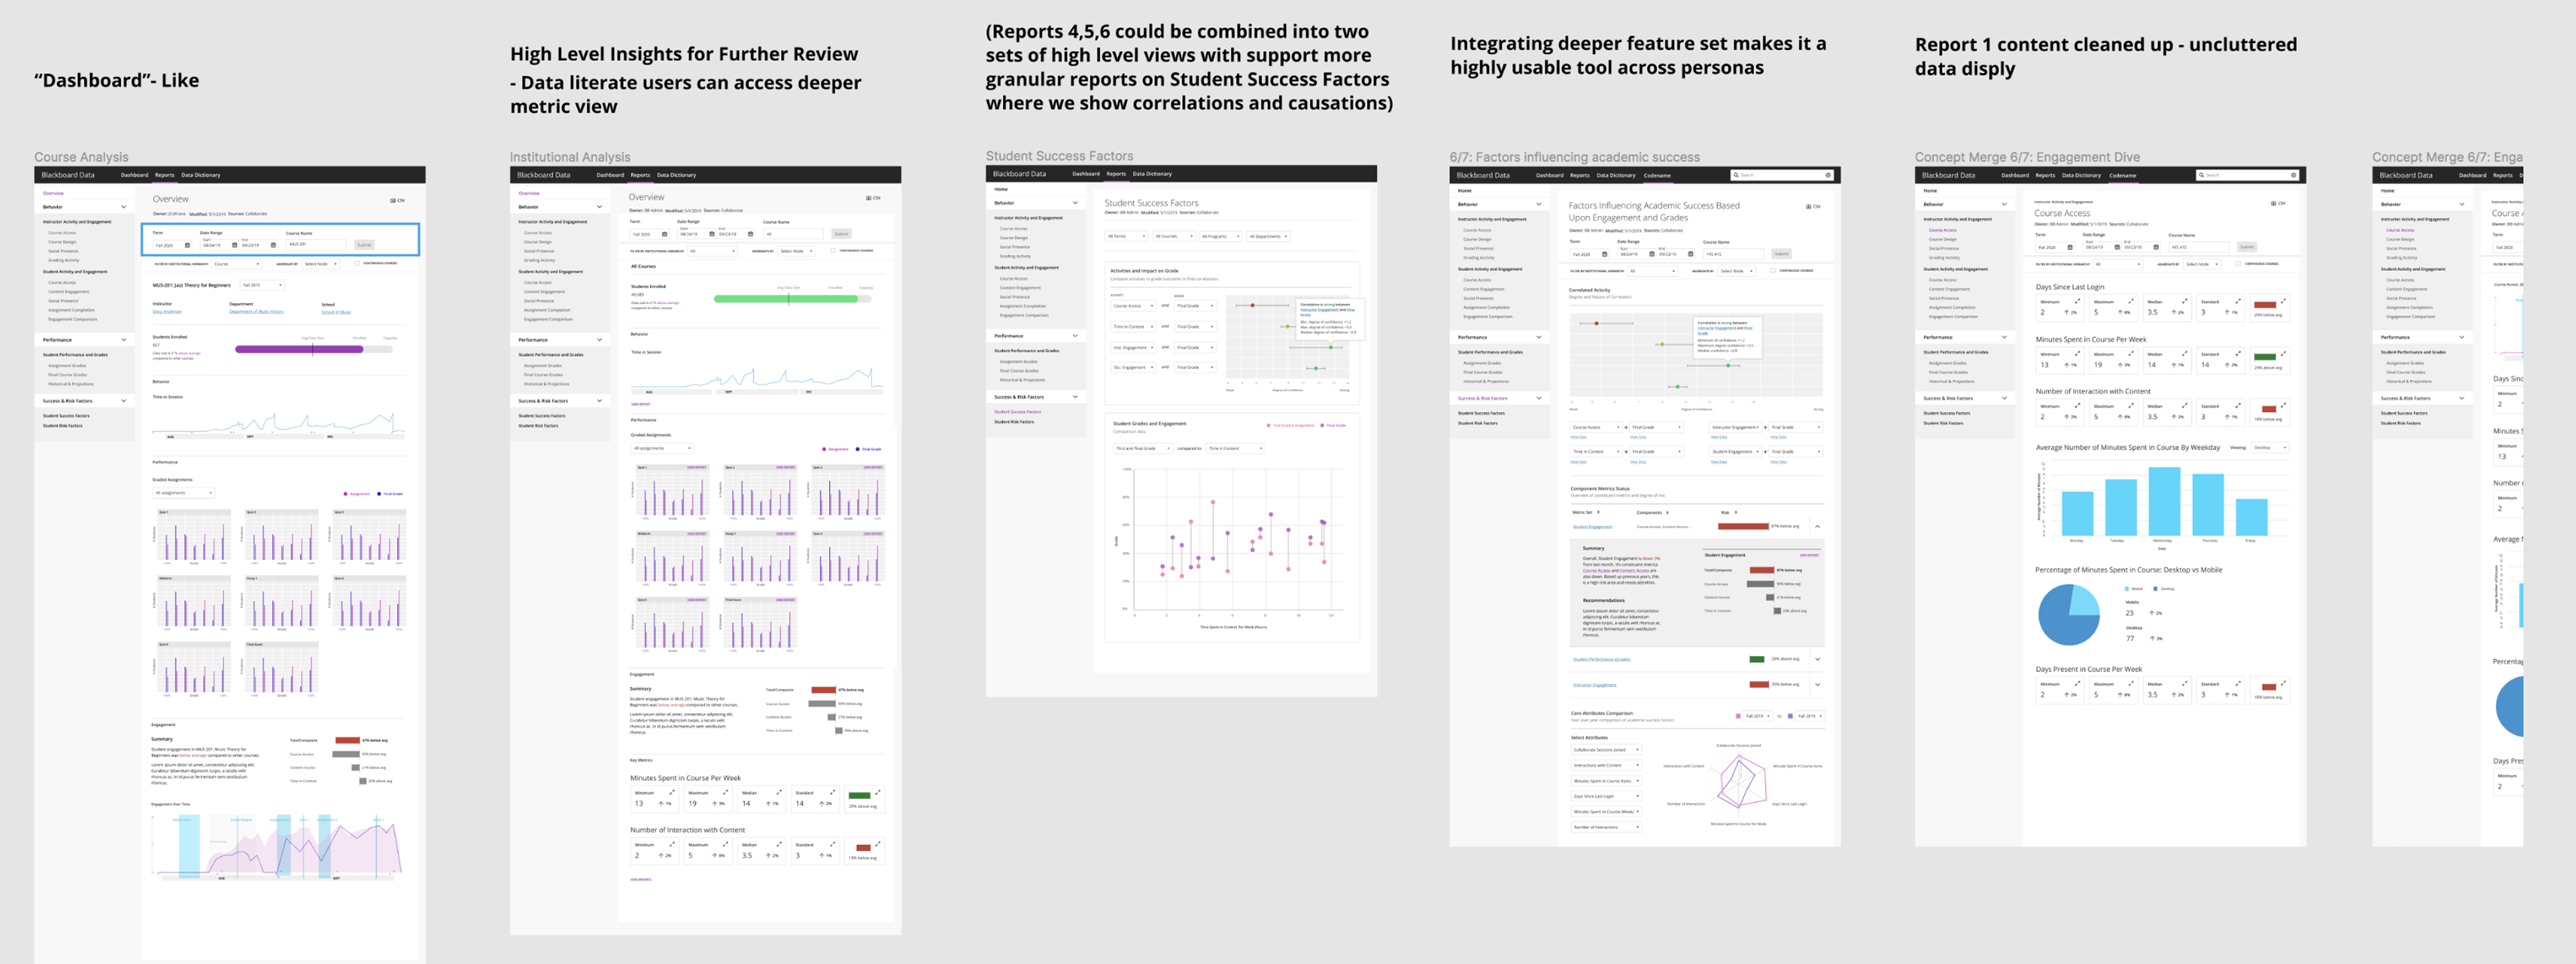
Once the team was aligned on lo-fi mockups, we moved to mid-fi screens for user review
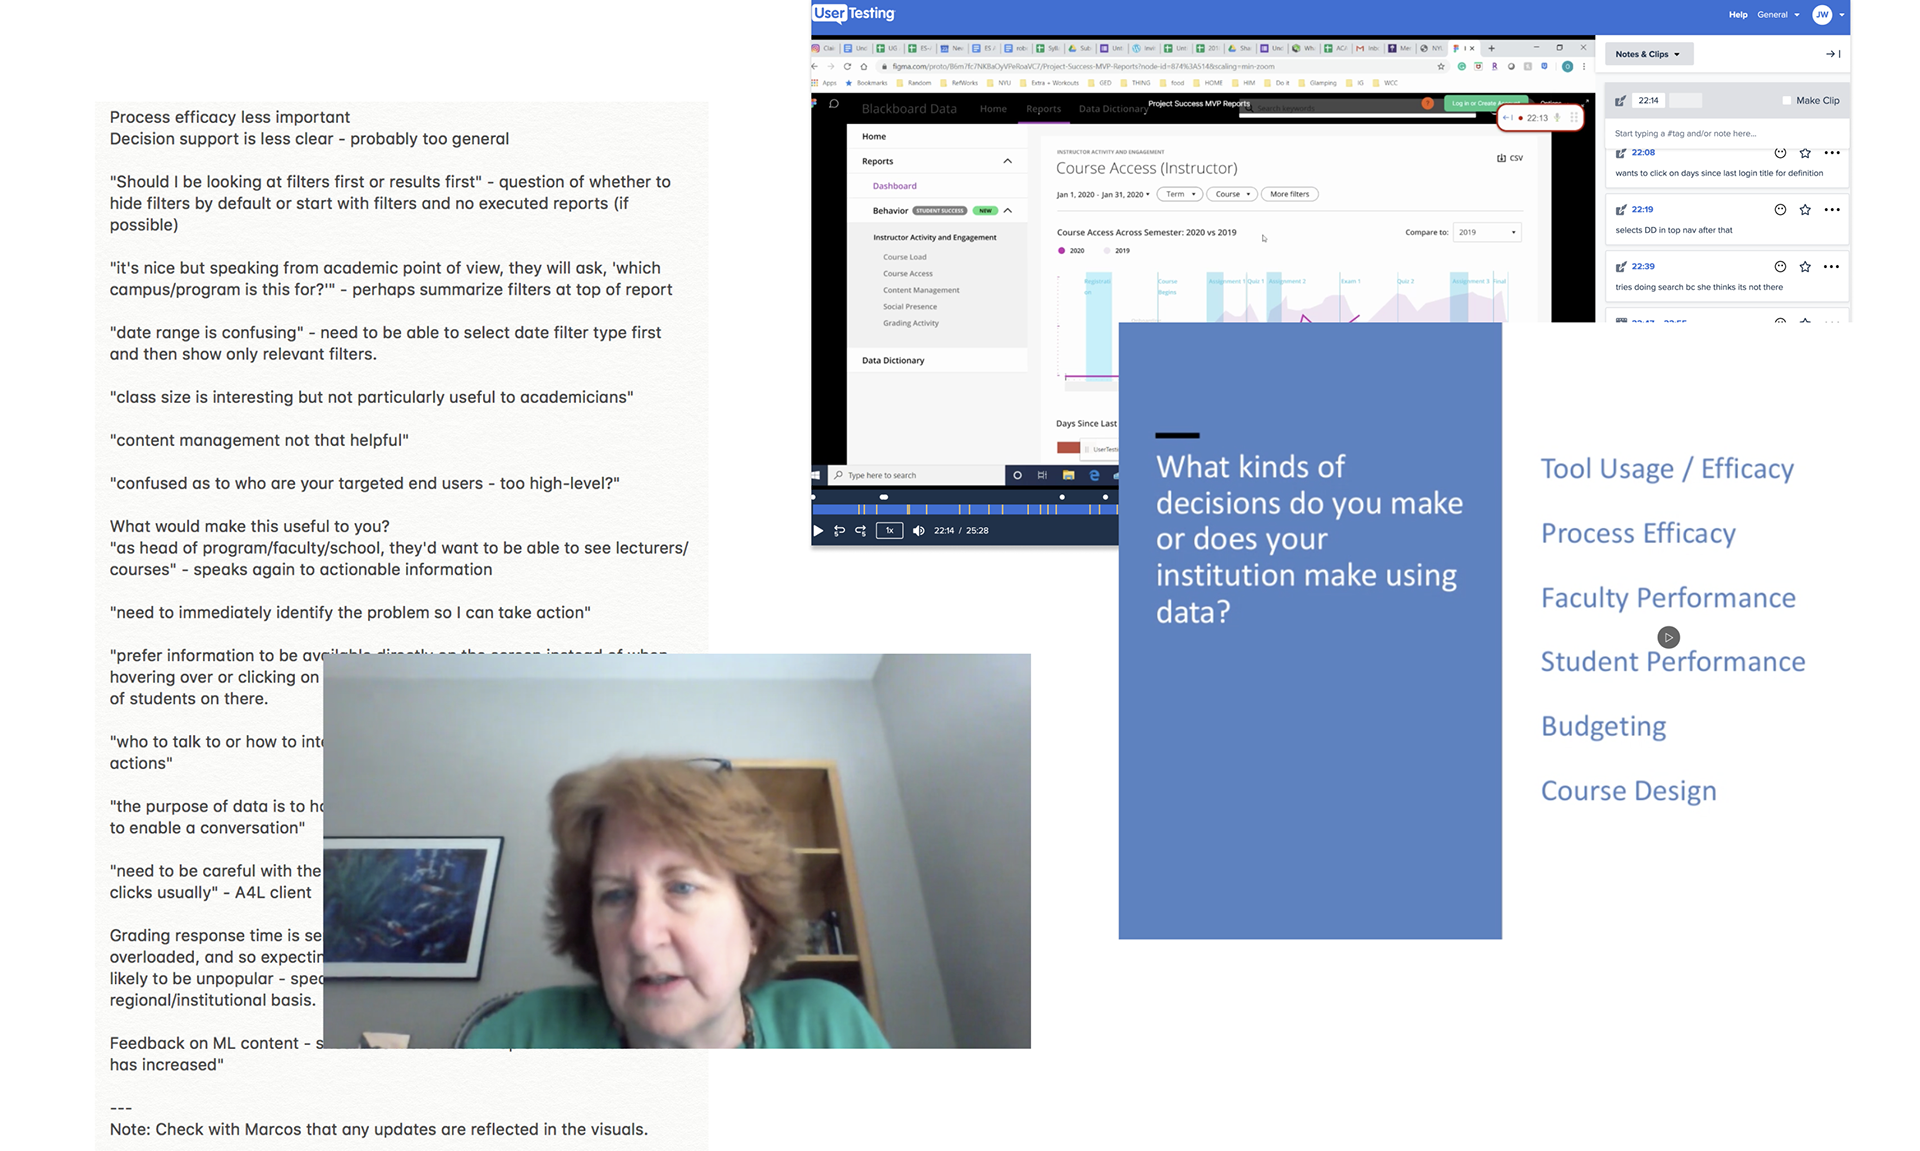
User Evaluation:
Concept evaluation was then done through moderated UserTesting sessions. Both usability testing and concept evaluation were administered to each user group. After synthesis, insights were shared, and the team aligned based on the feedback. When overlayed with existing research, we determined that further iterations were necessary.
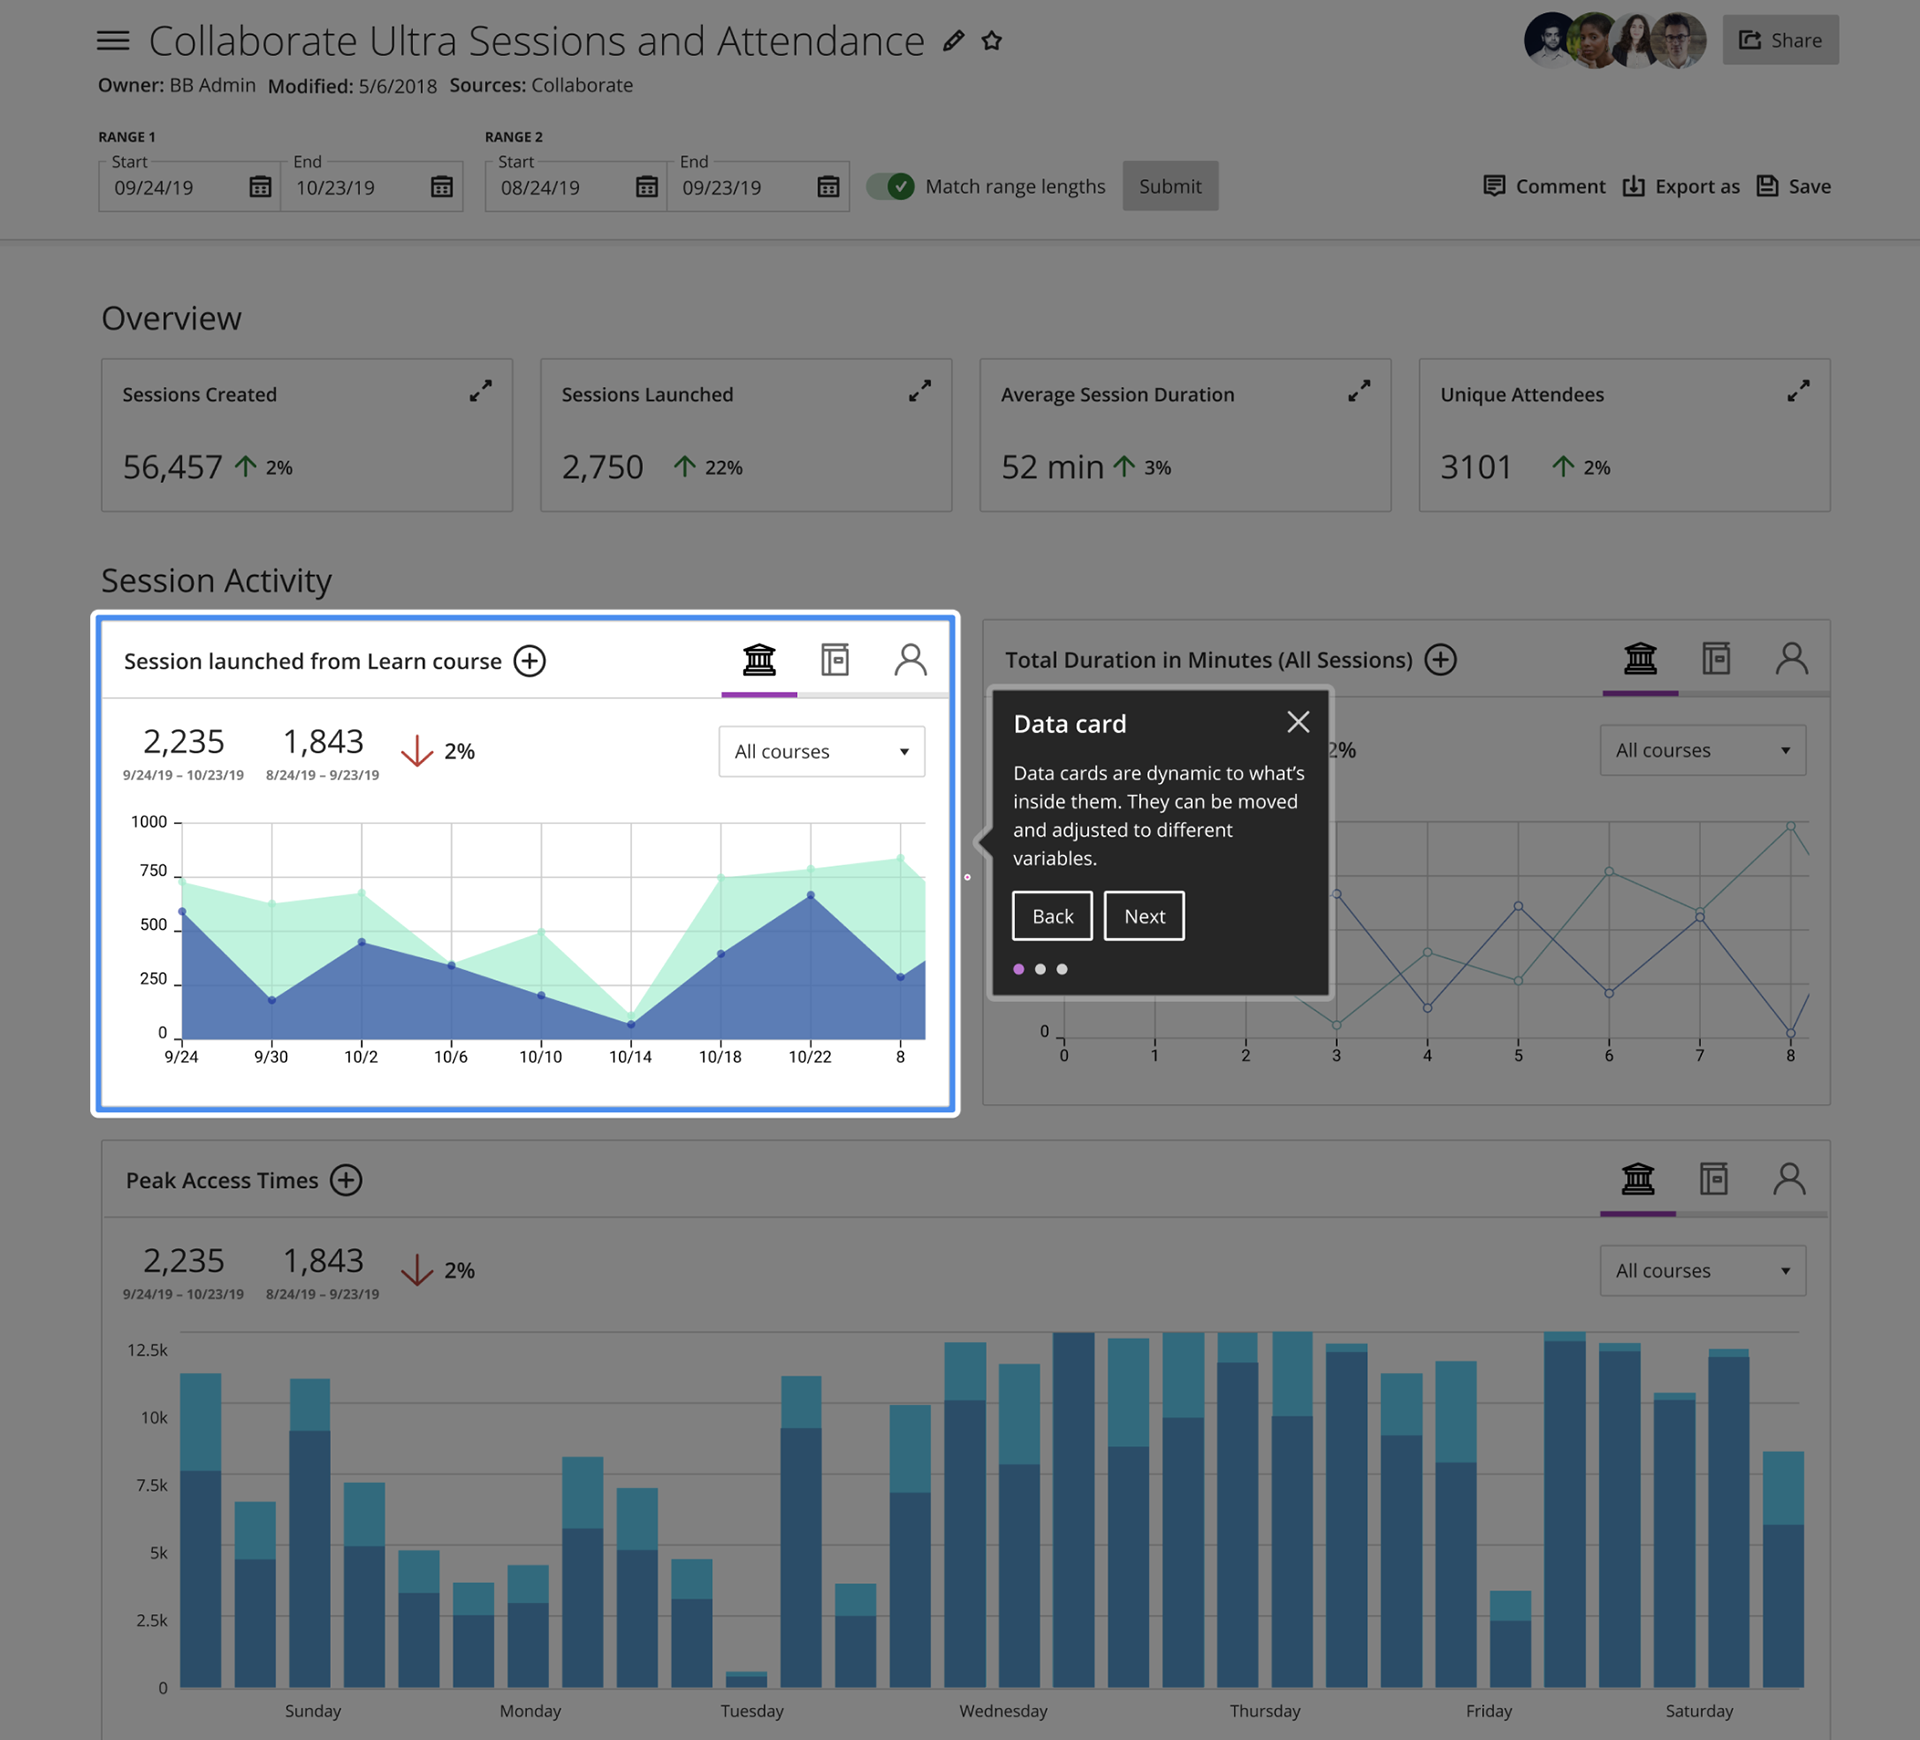
Prototyping:
User insights helped us understand that we needed to implement customizable user views and rethink collaboration tools. In addition to to this, we modified data drilling (along with understanding what guardrails would be necessary regarding this), and added explanatory copy where users felt they needed more information or guidance.
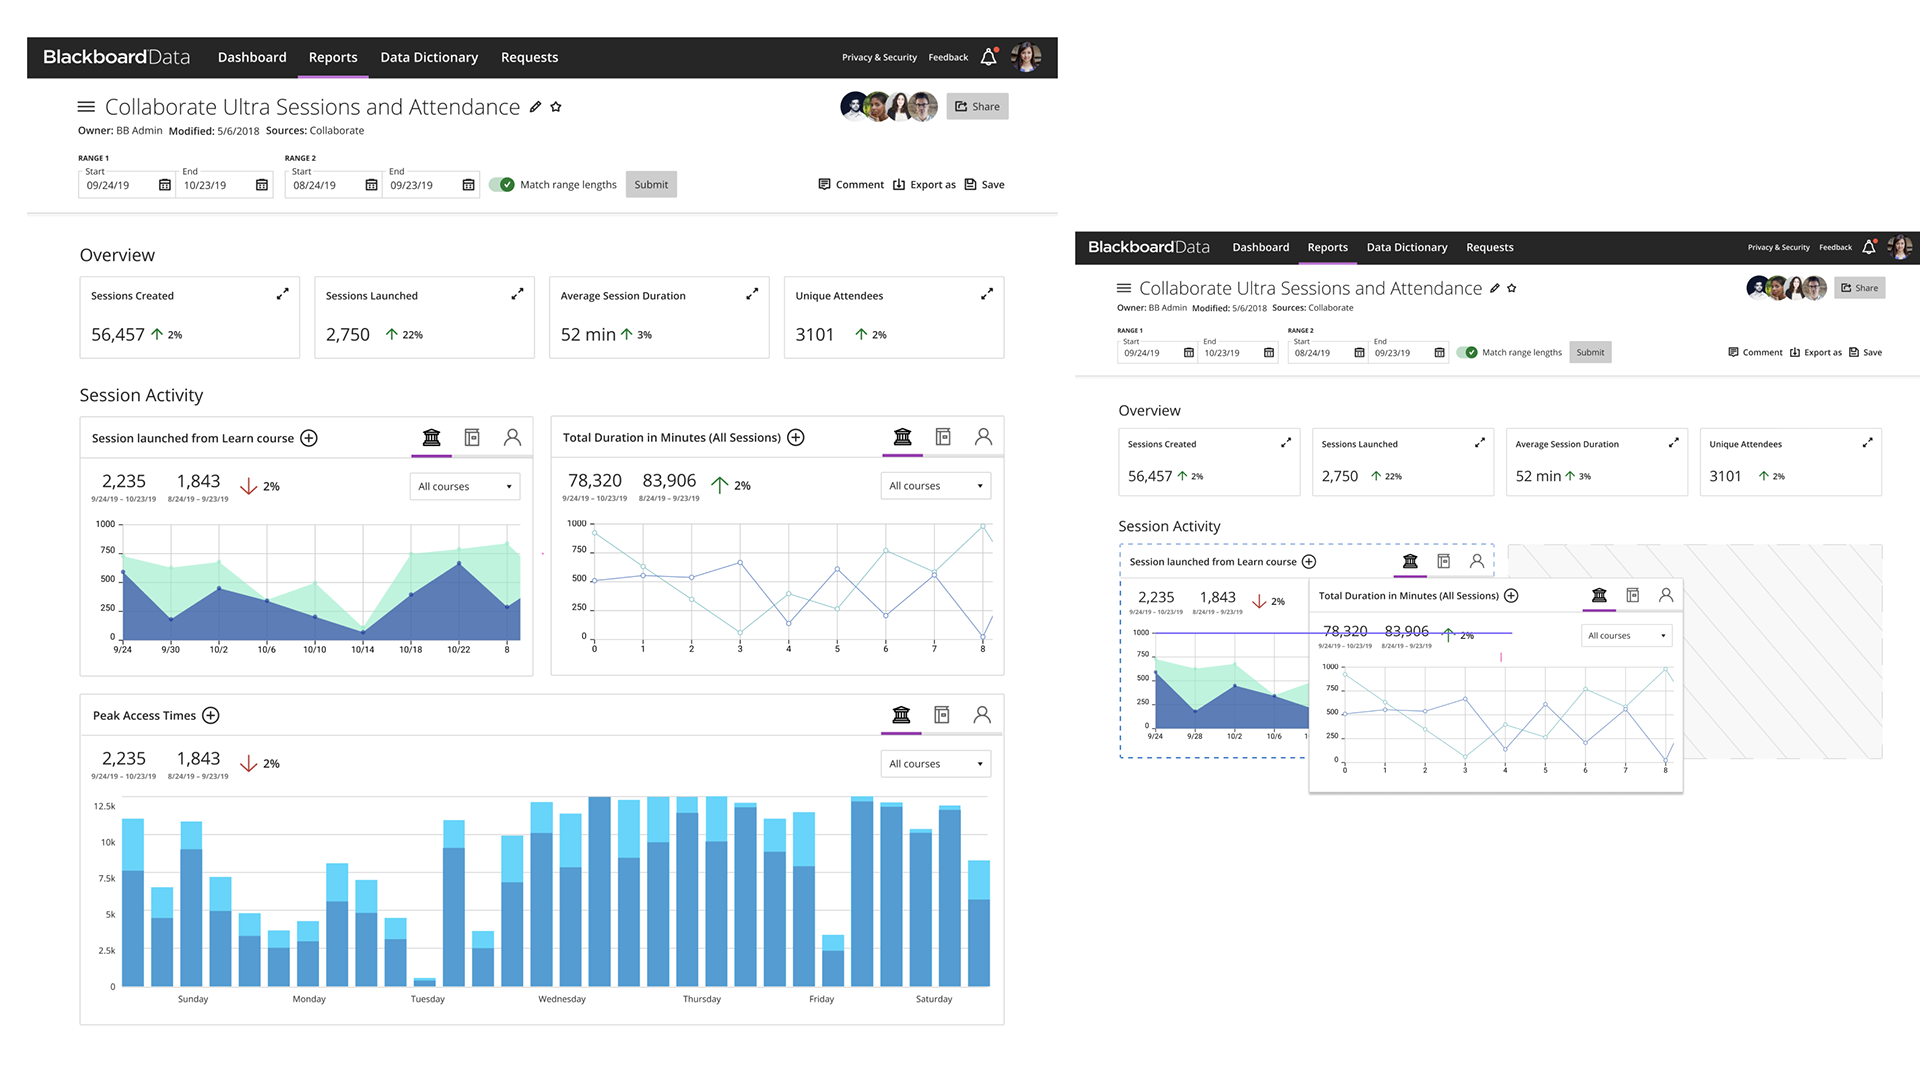
Iteration and Refinement:
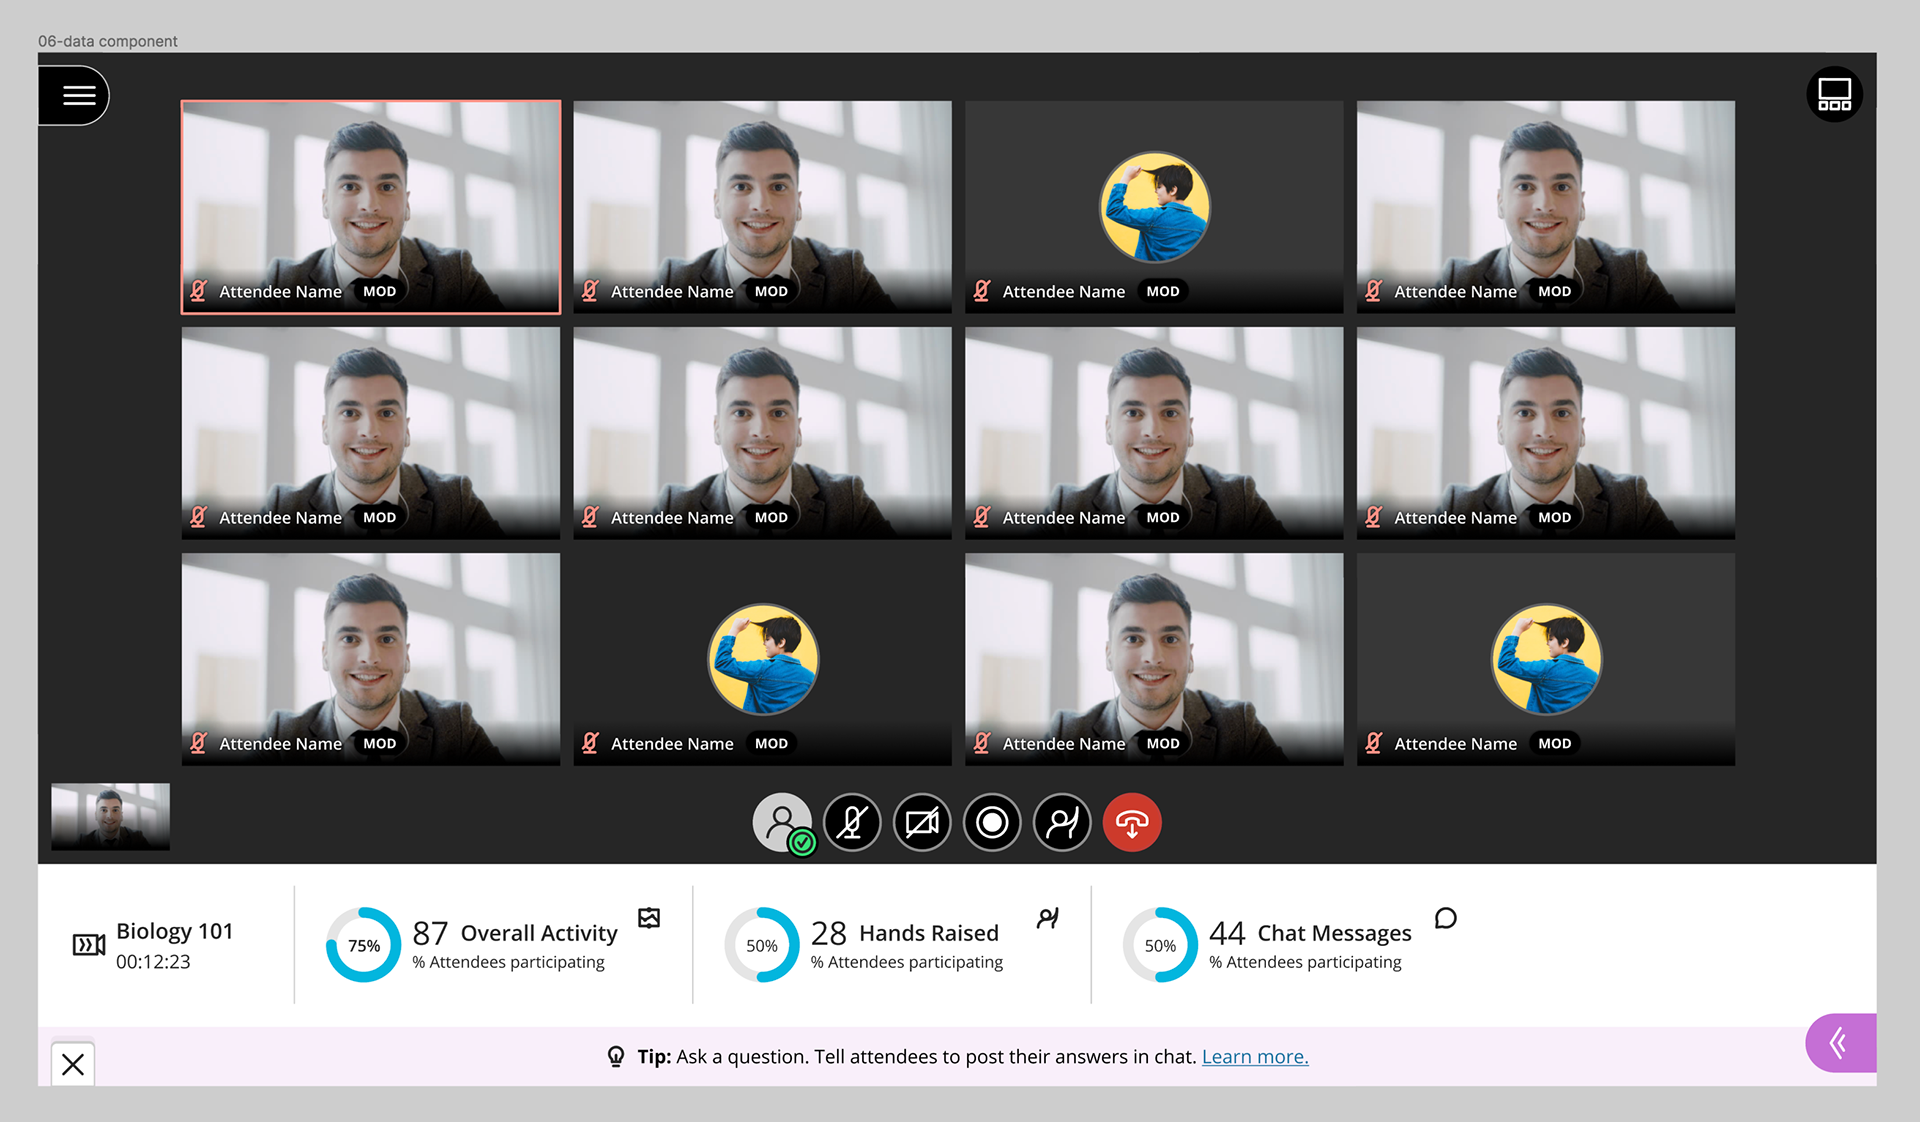
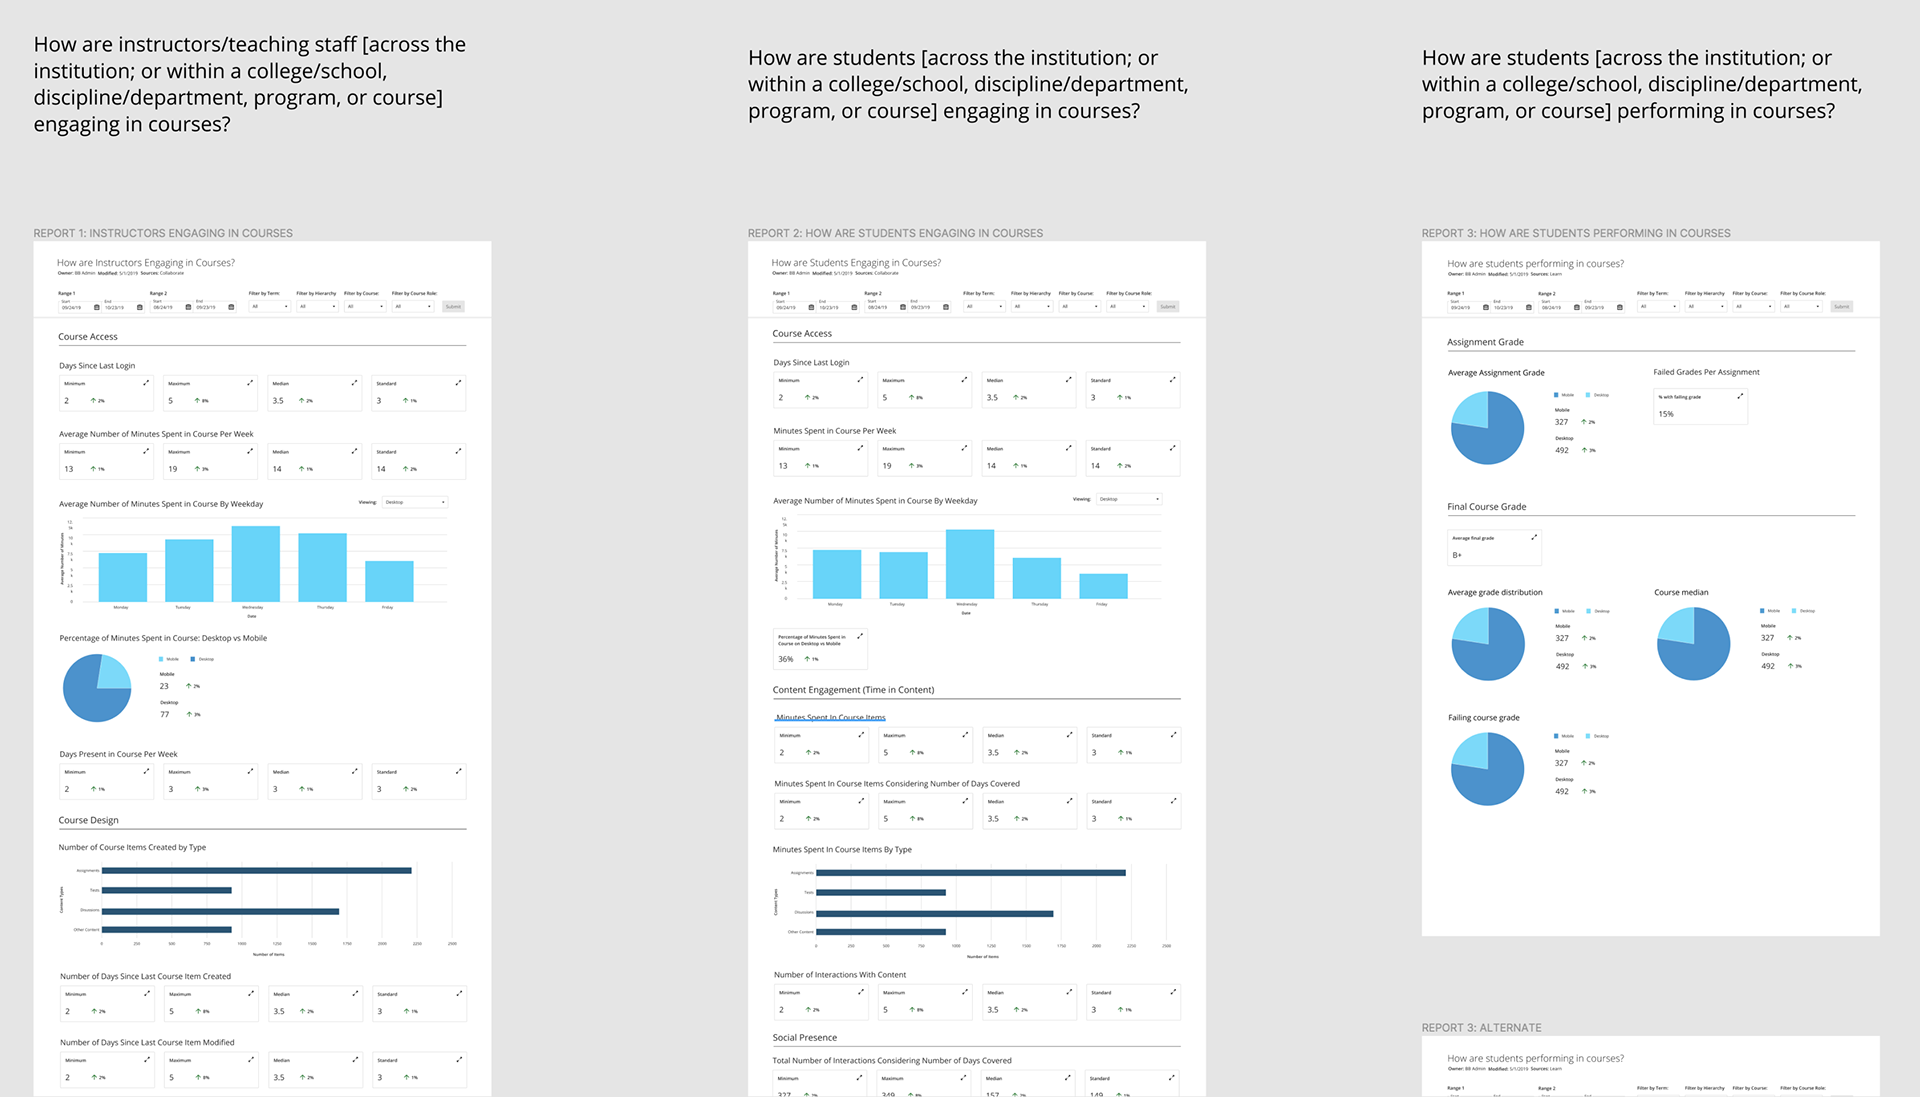
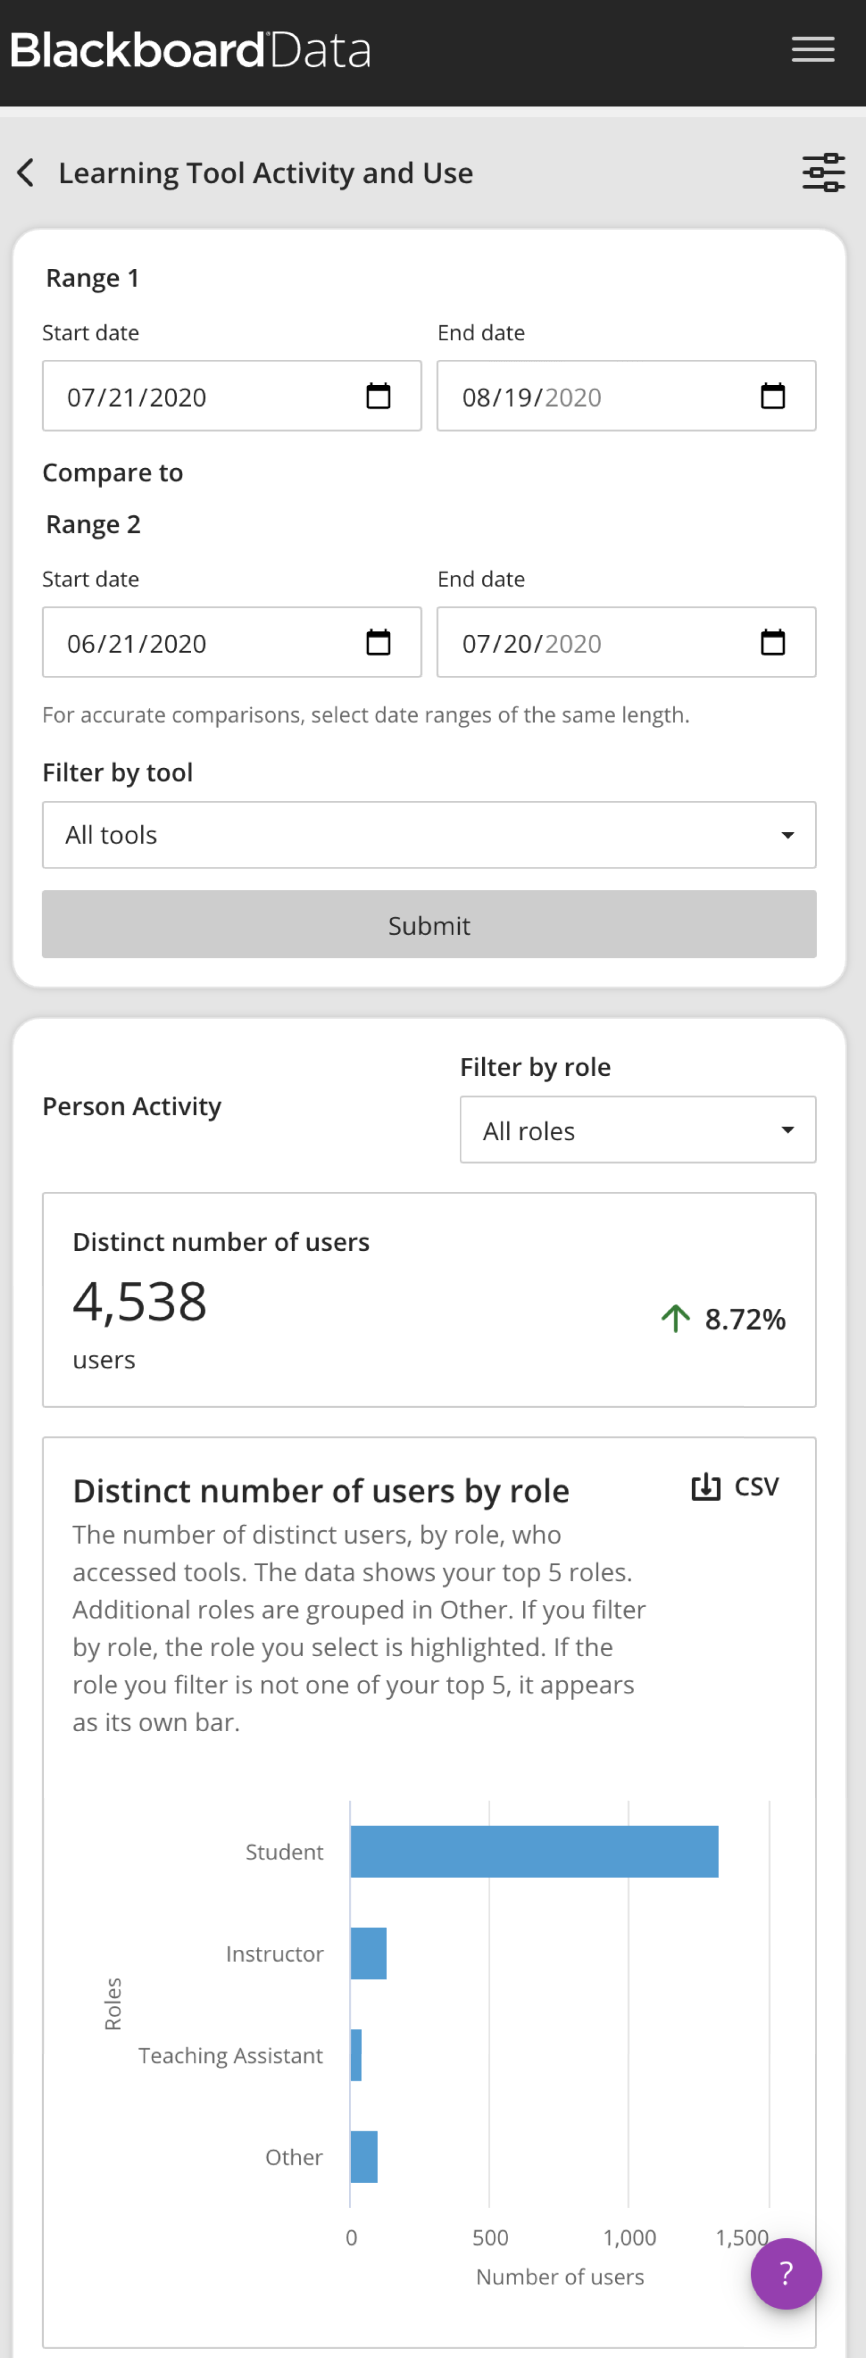
Visualizations were also iterated upon to provide more high level summaries of overall student academic risk. Users seemed to strongly prefer views that displayed quantitative changes over the course of the semester. The importance of comparison data was also highlighted as an area of focus.

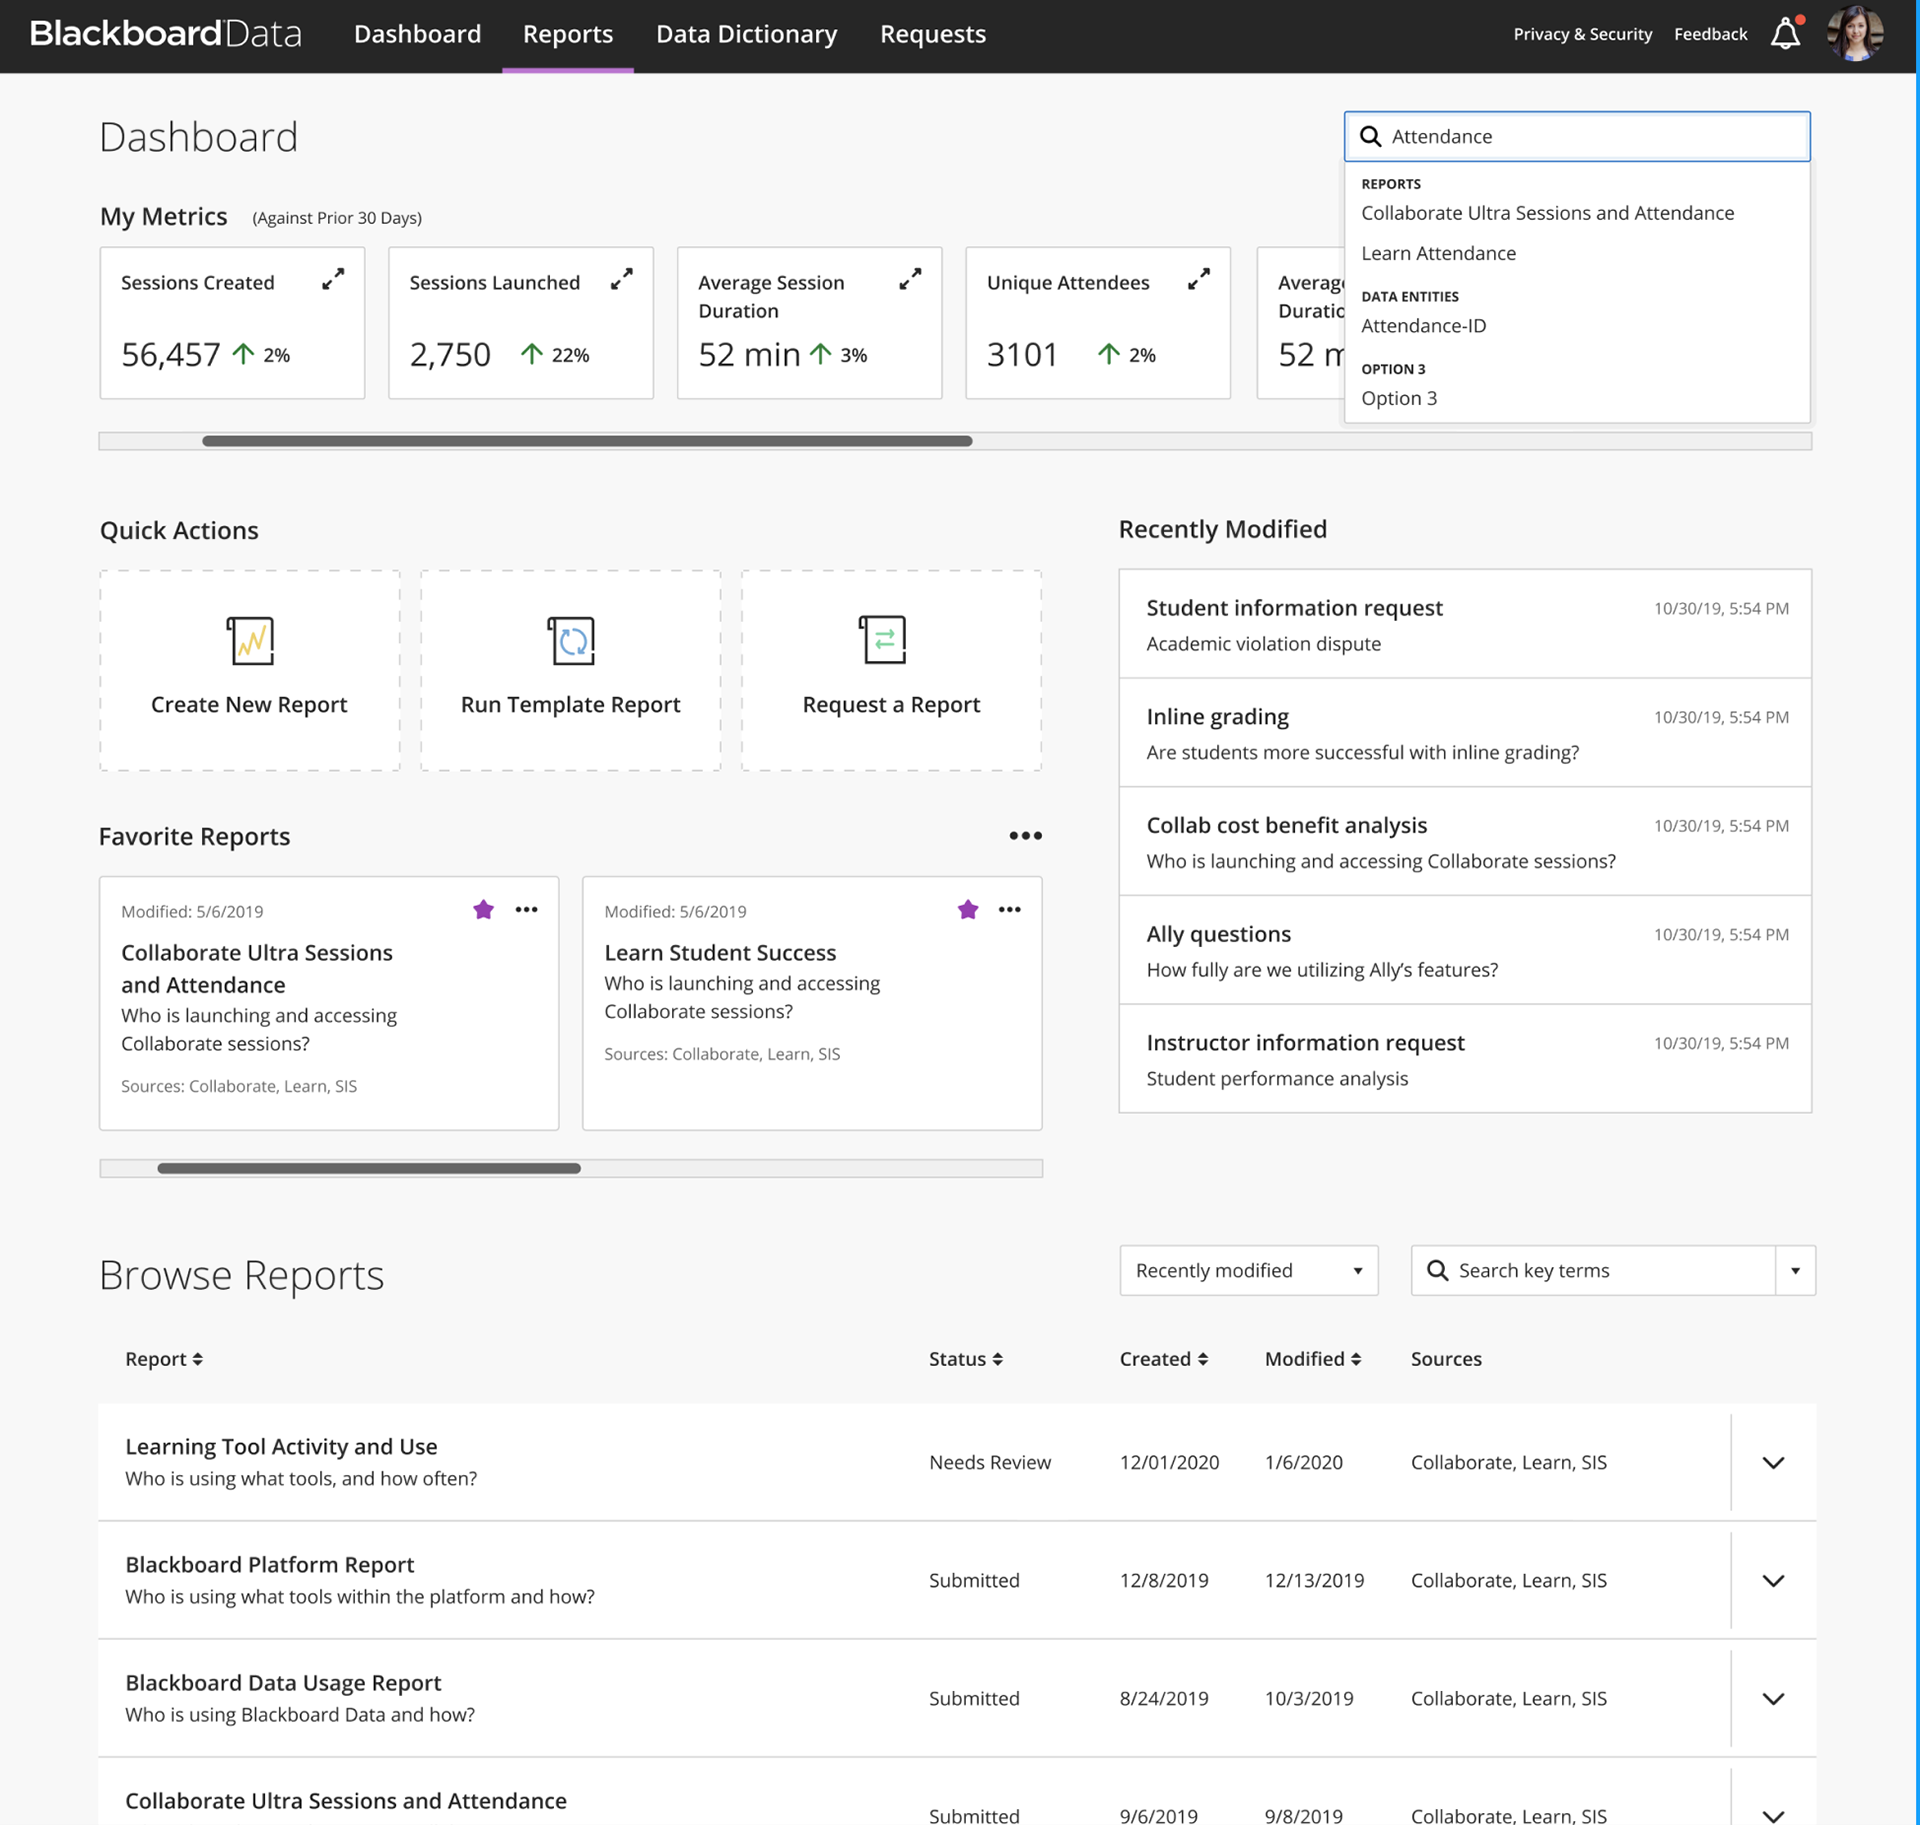
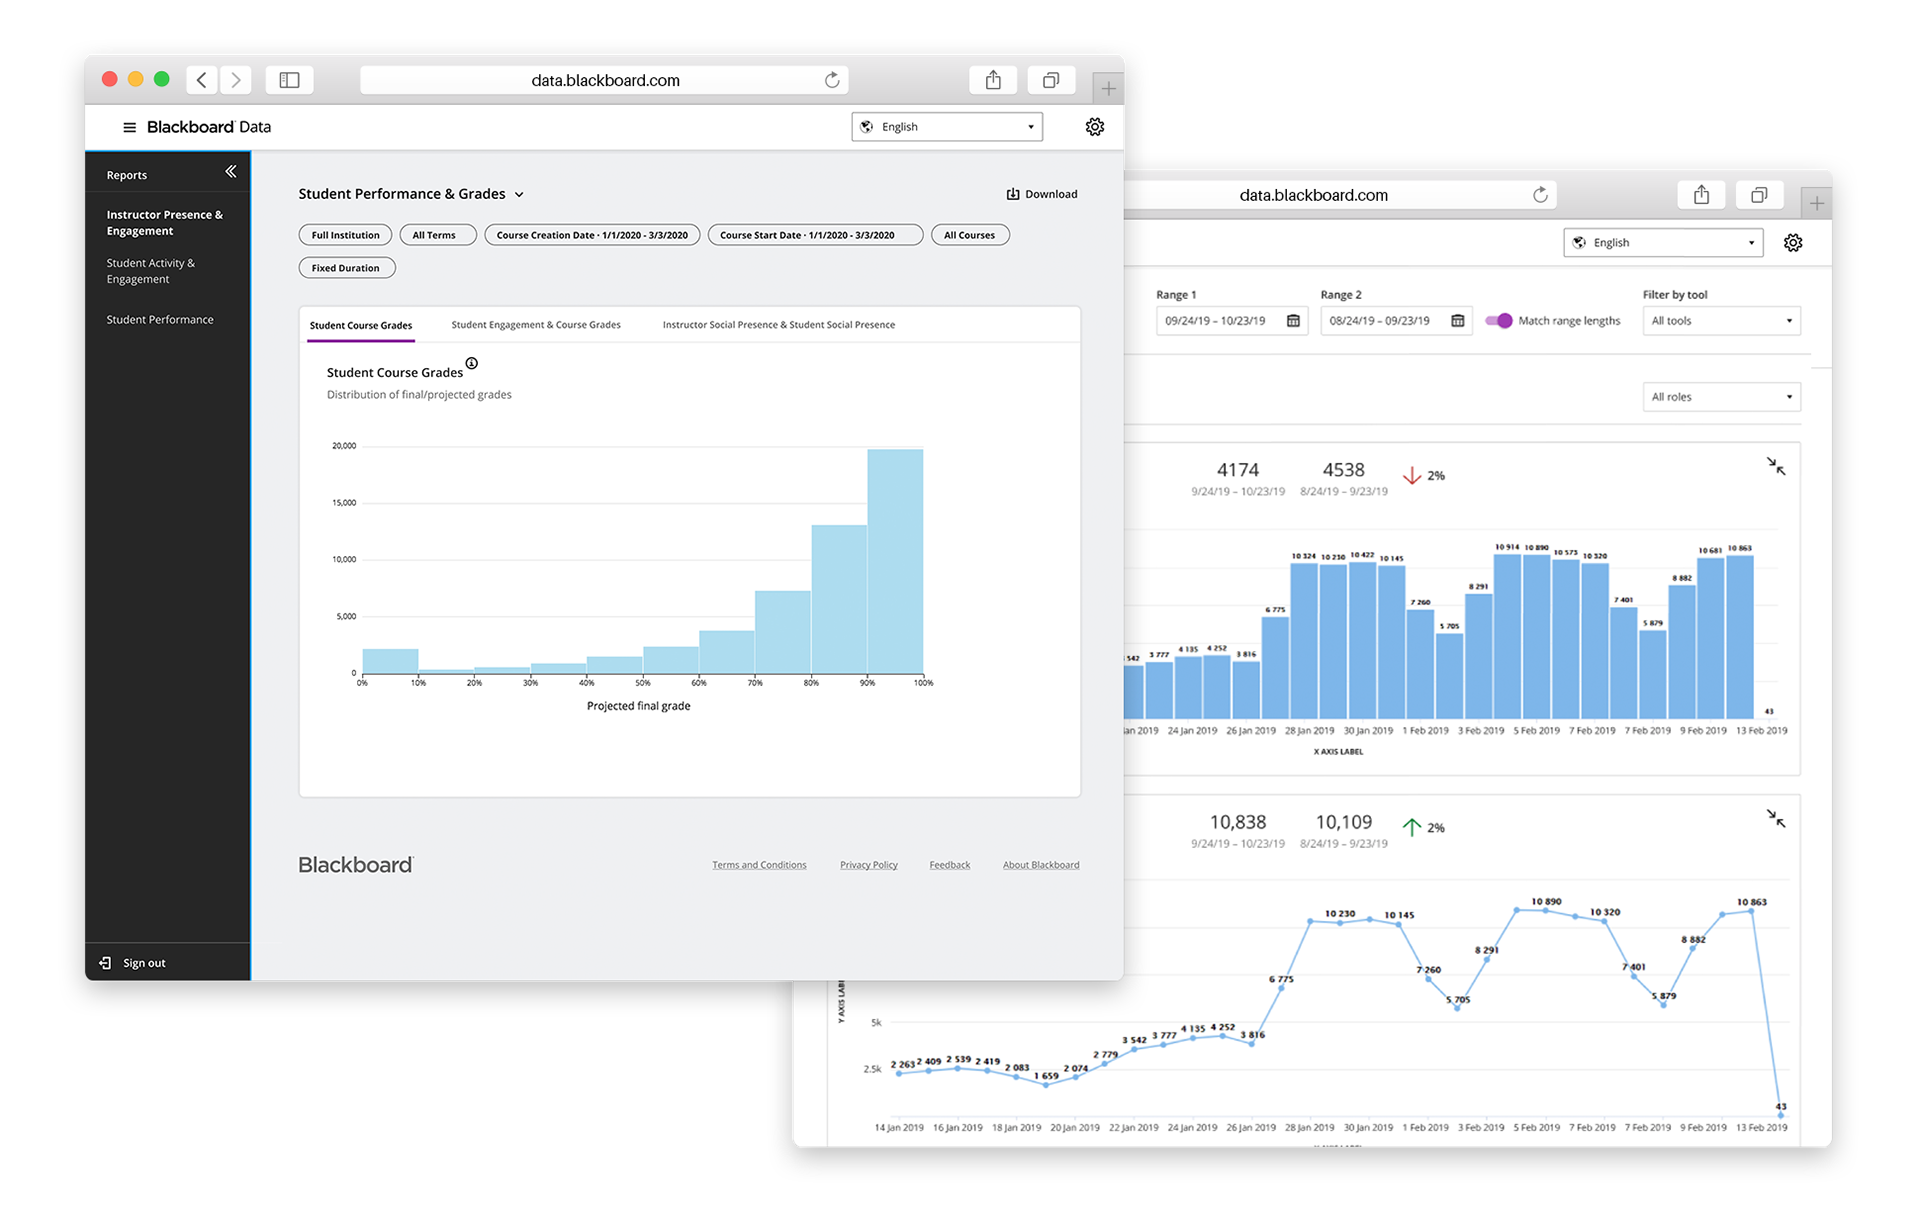
GA Launch:
A GA / MVP release was then finalized for authorized users. Iterations and research activities followed. This experience merges both the data reporting workflow and the entity relationship diagram / data dictionary functionality into a single experience. A marketing homepage helps position the product promise.
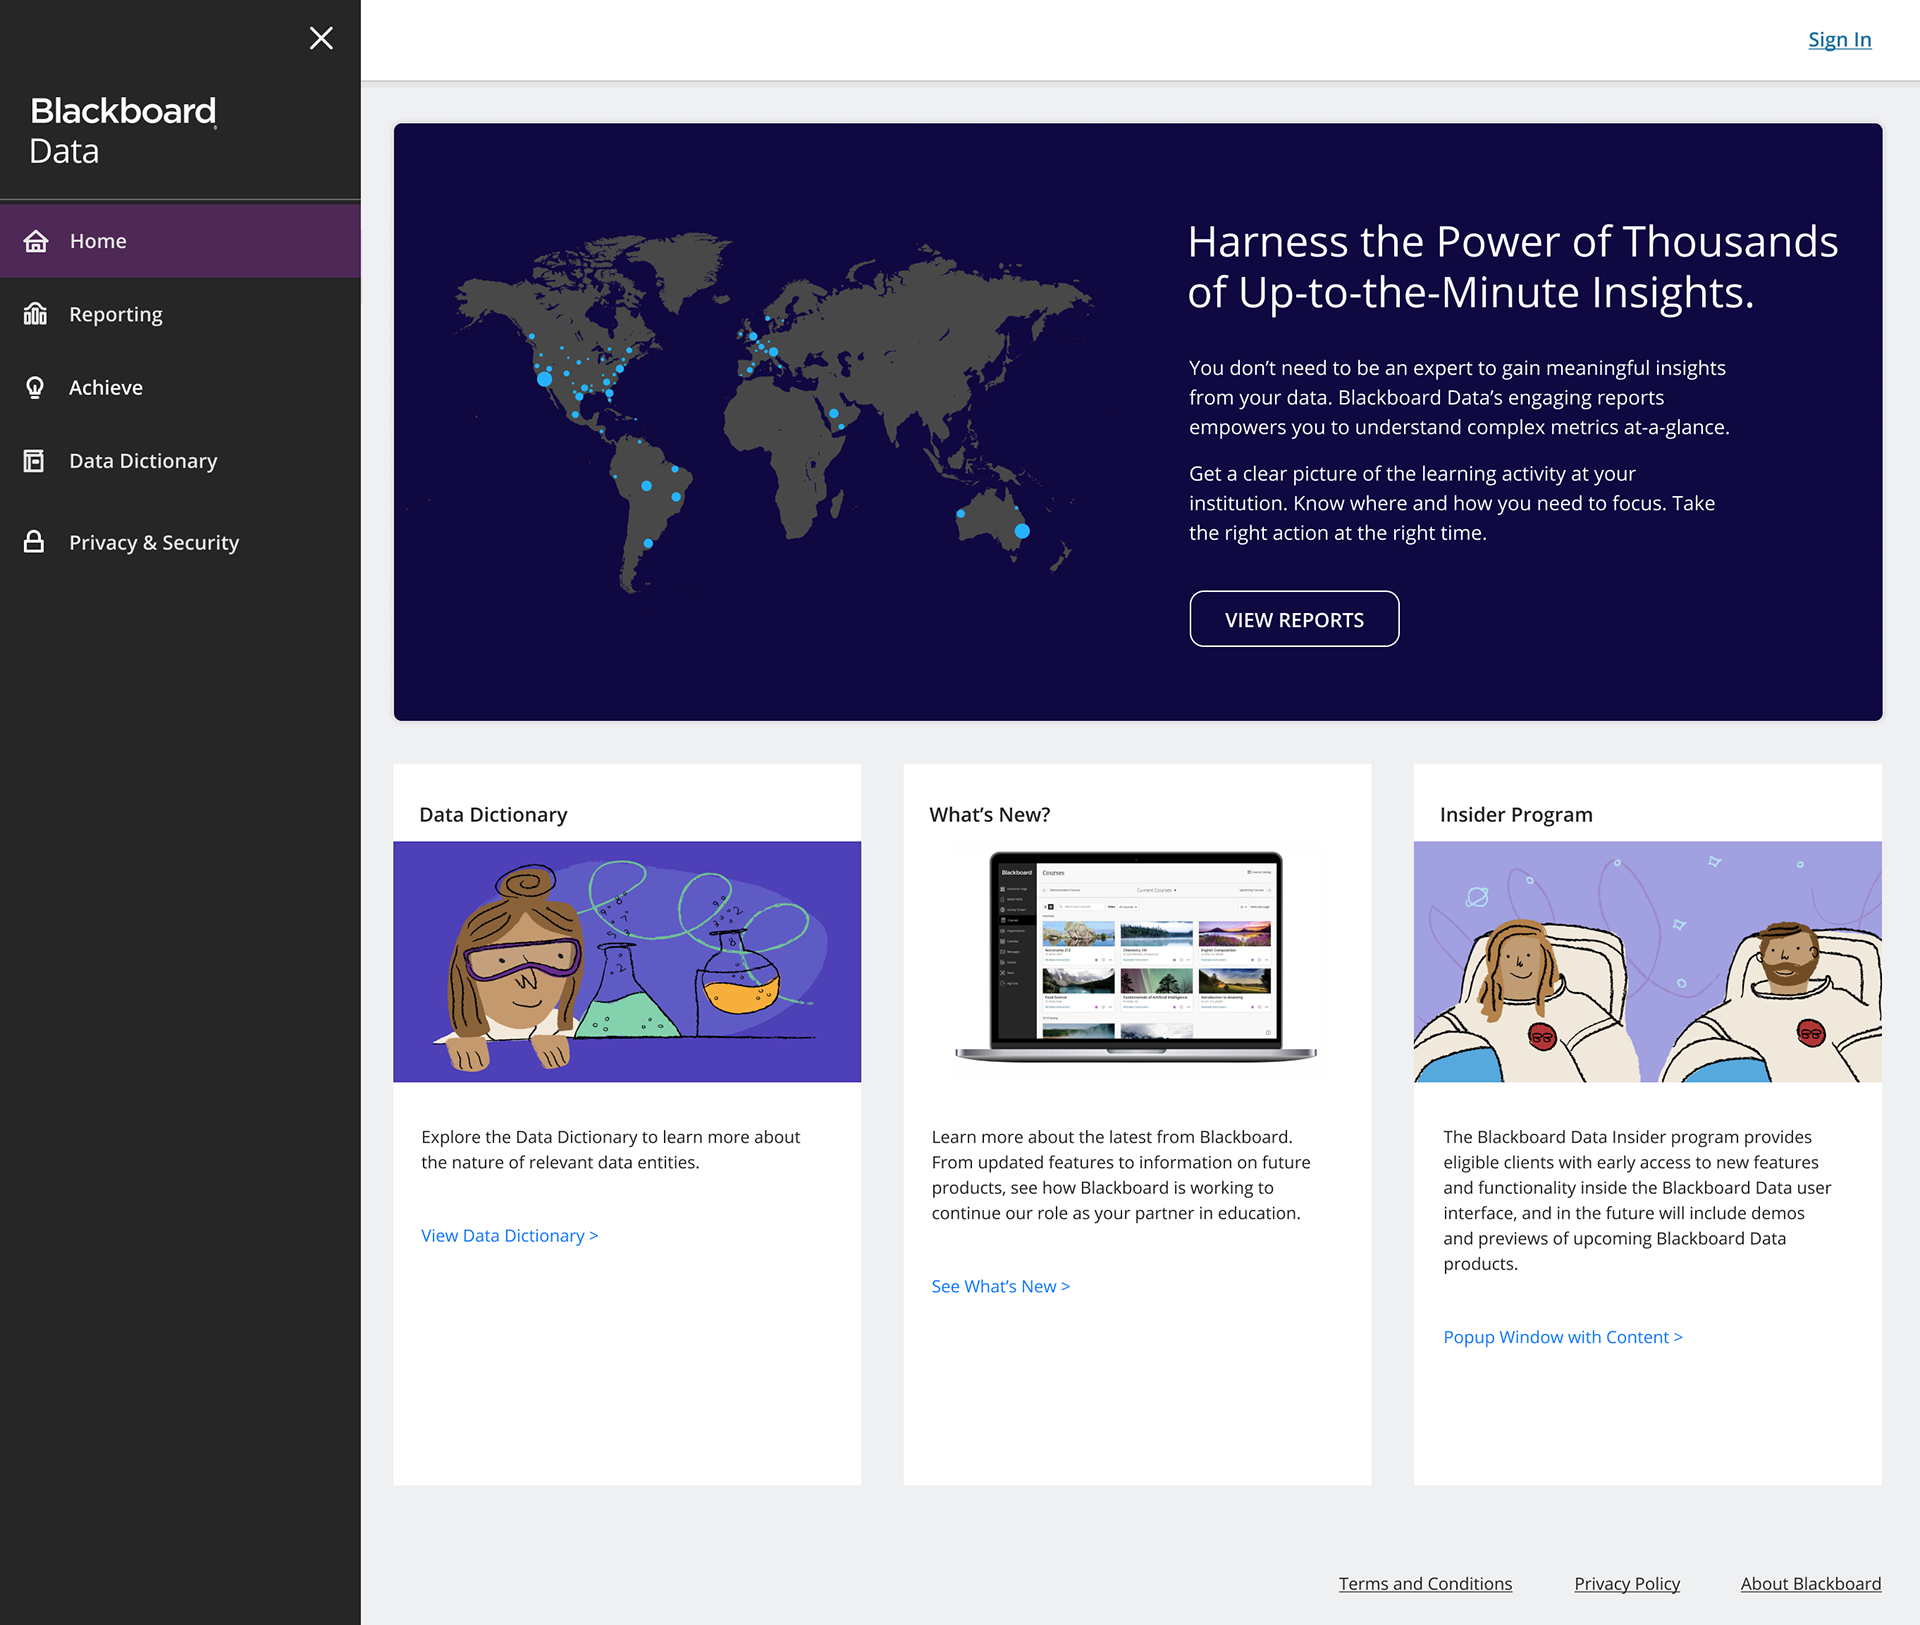
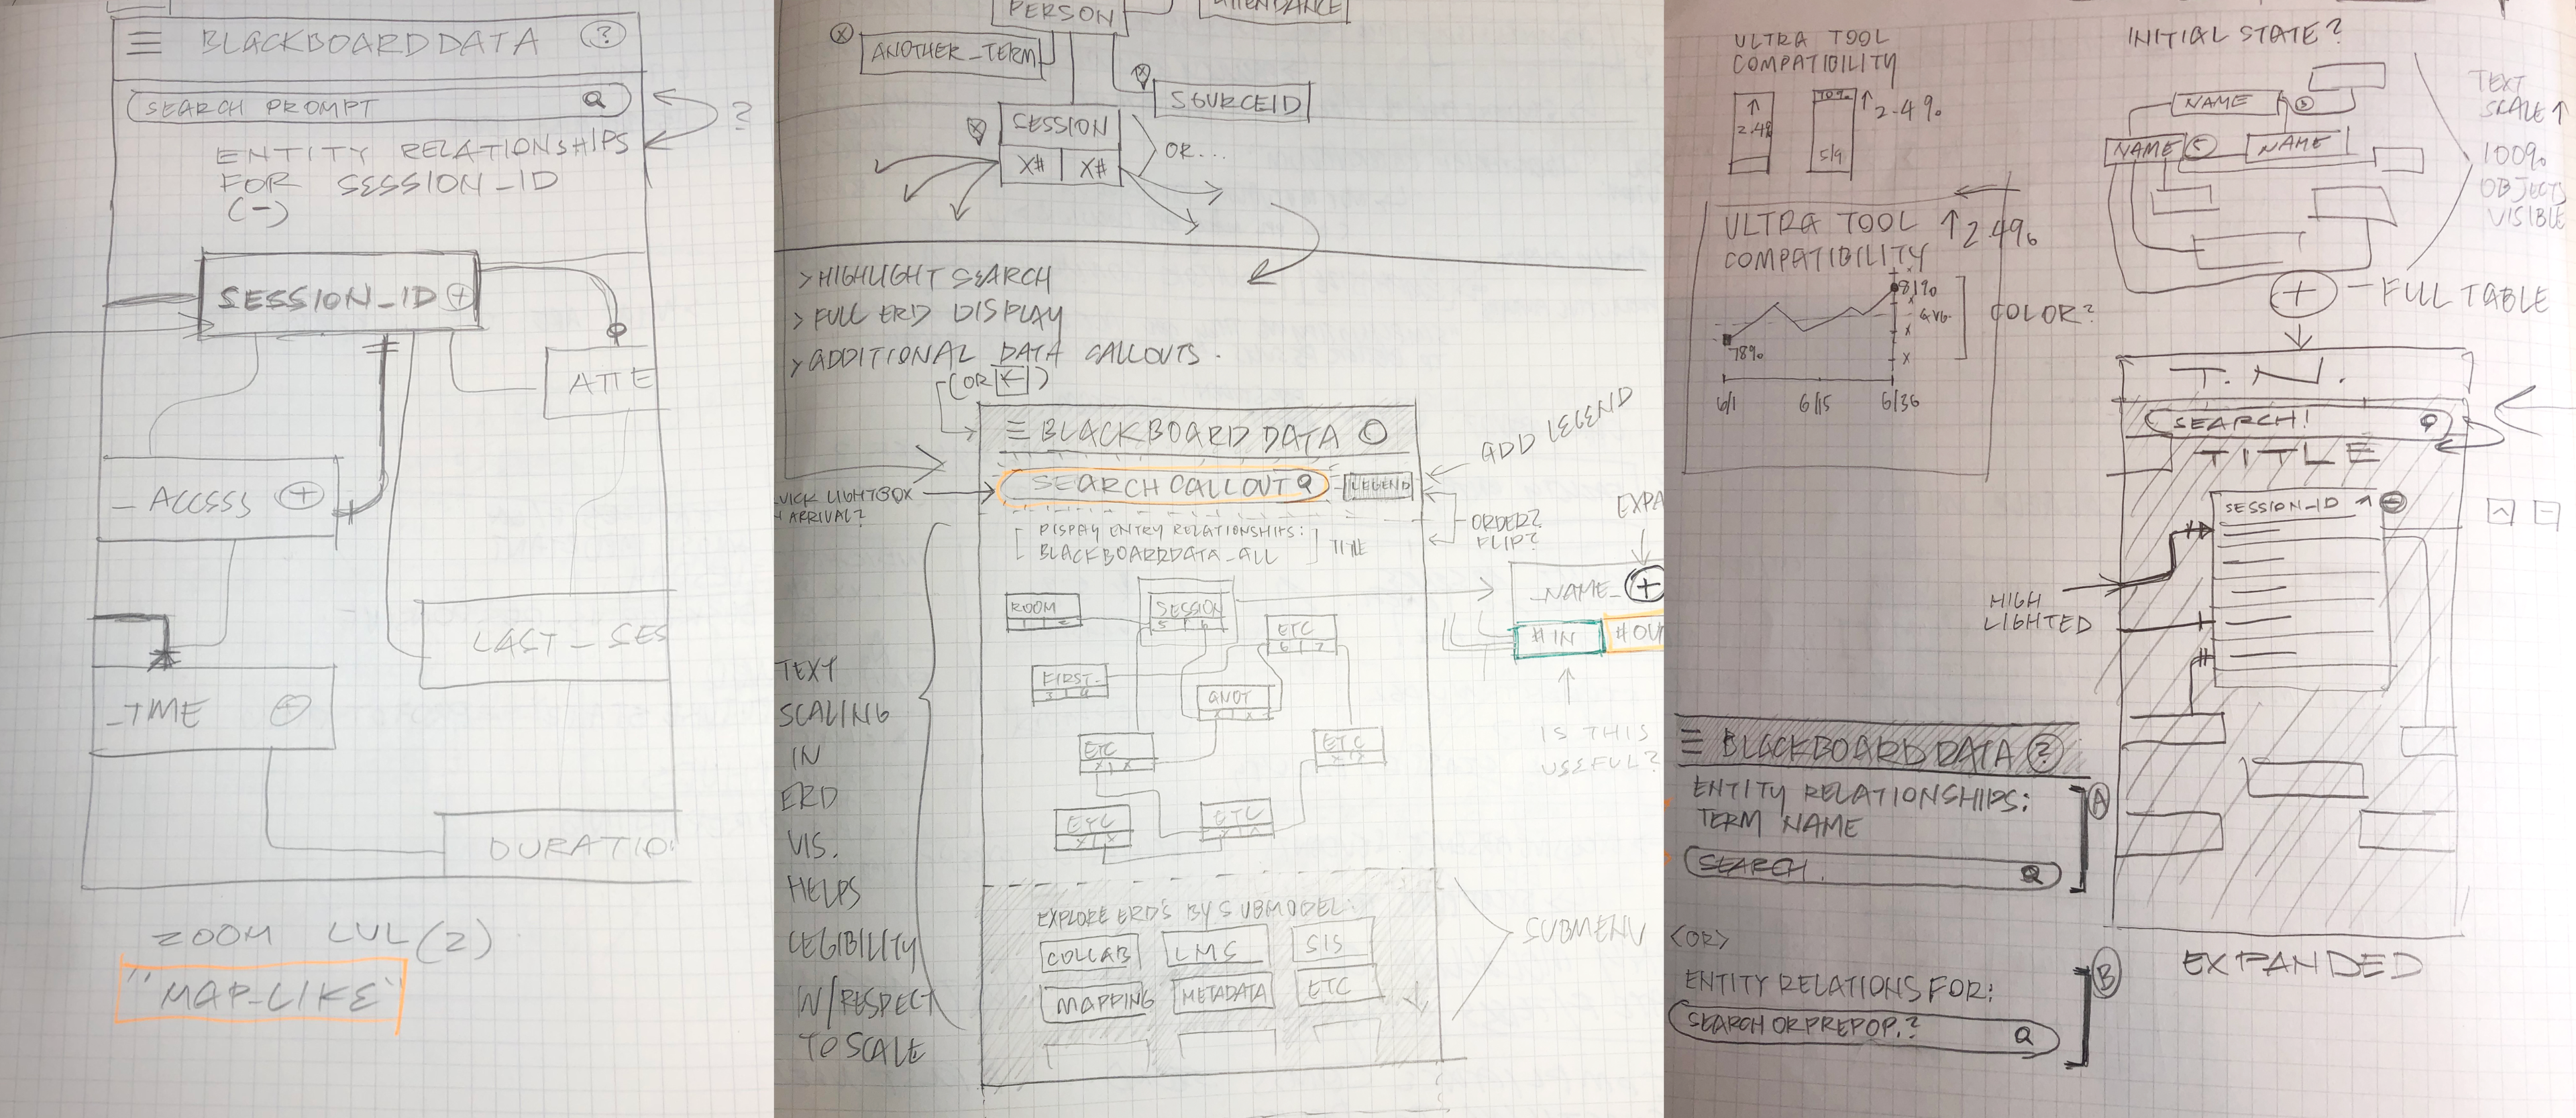
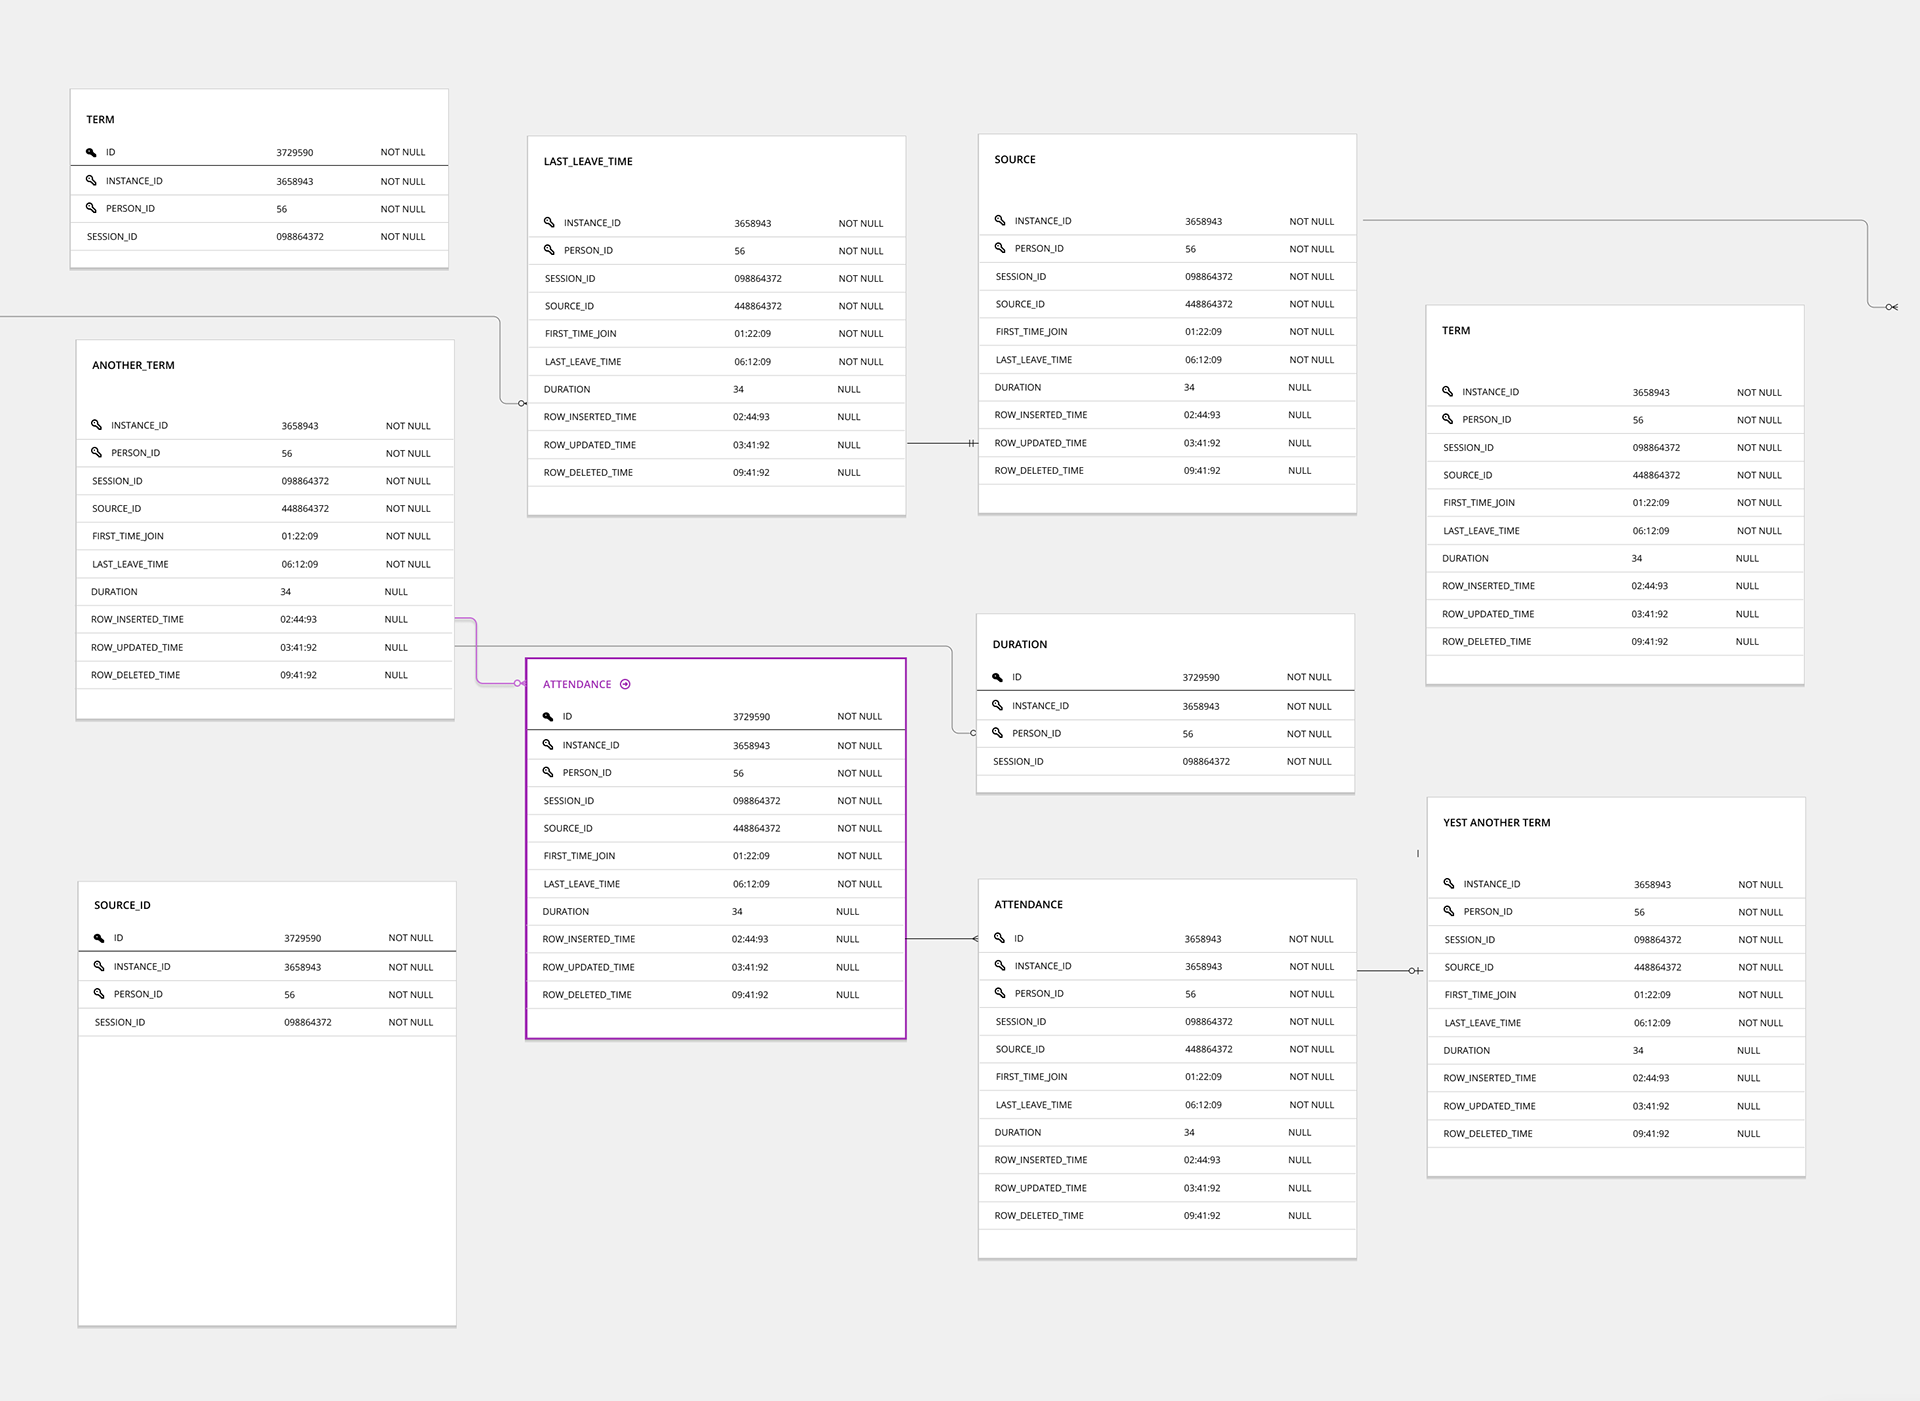
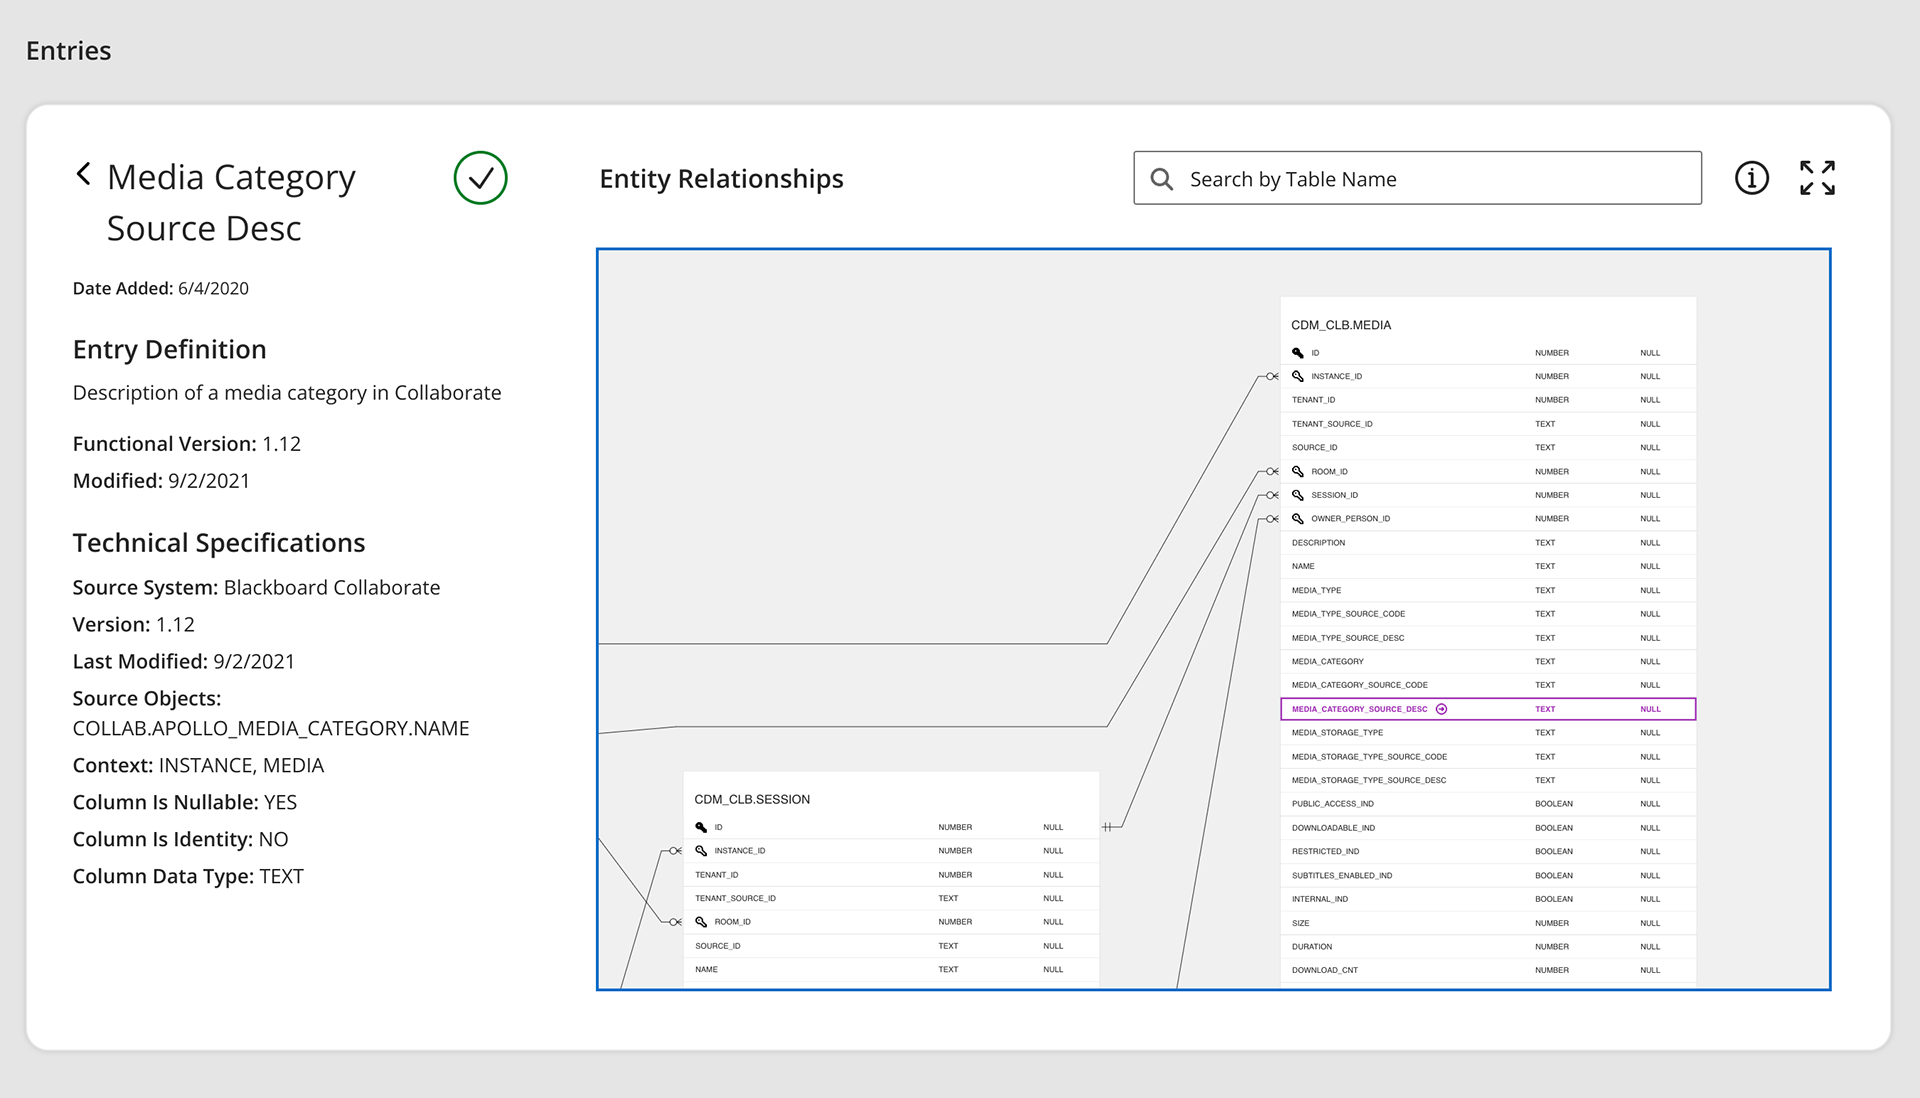
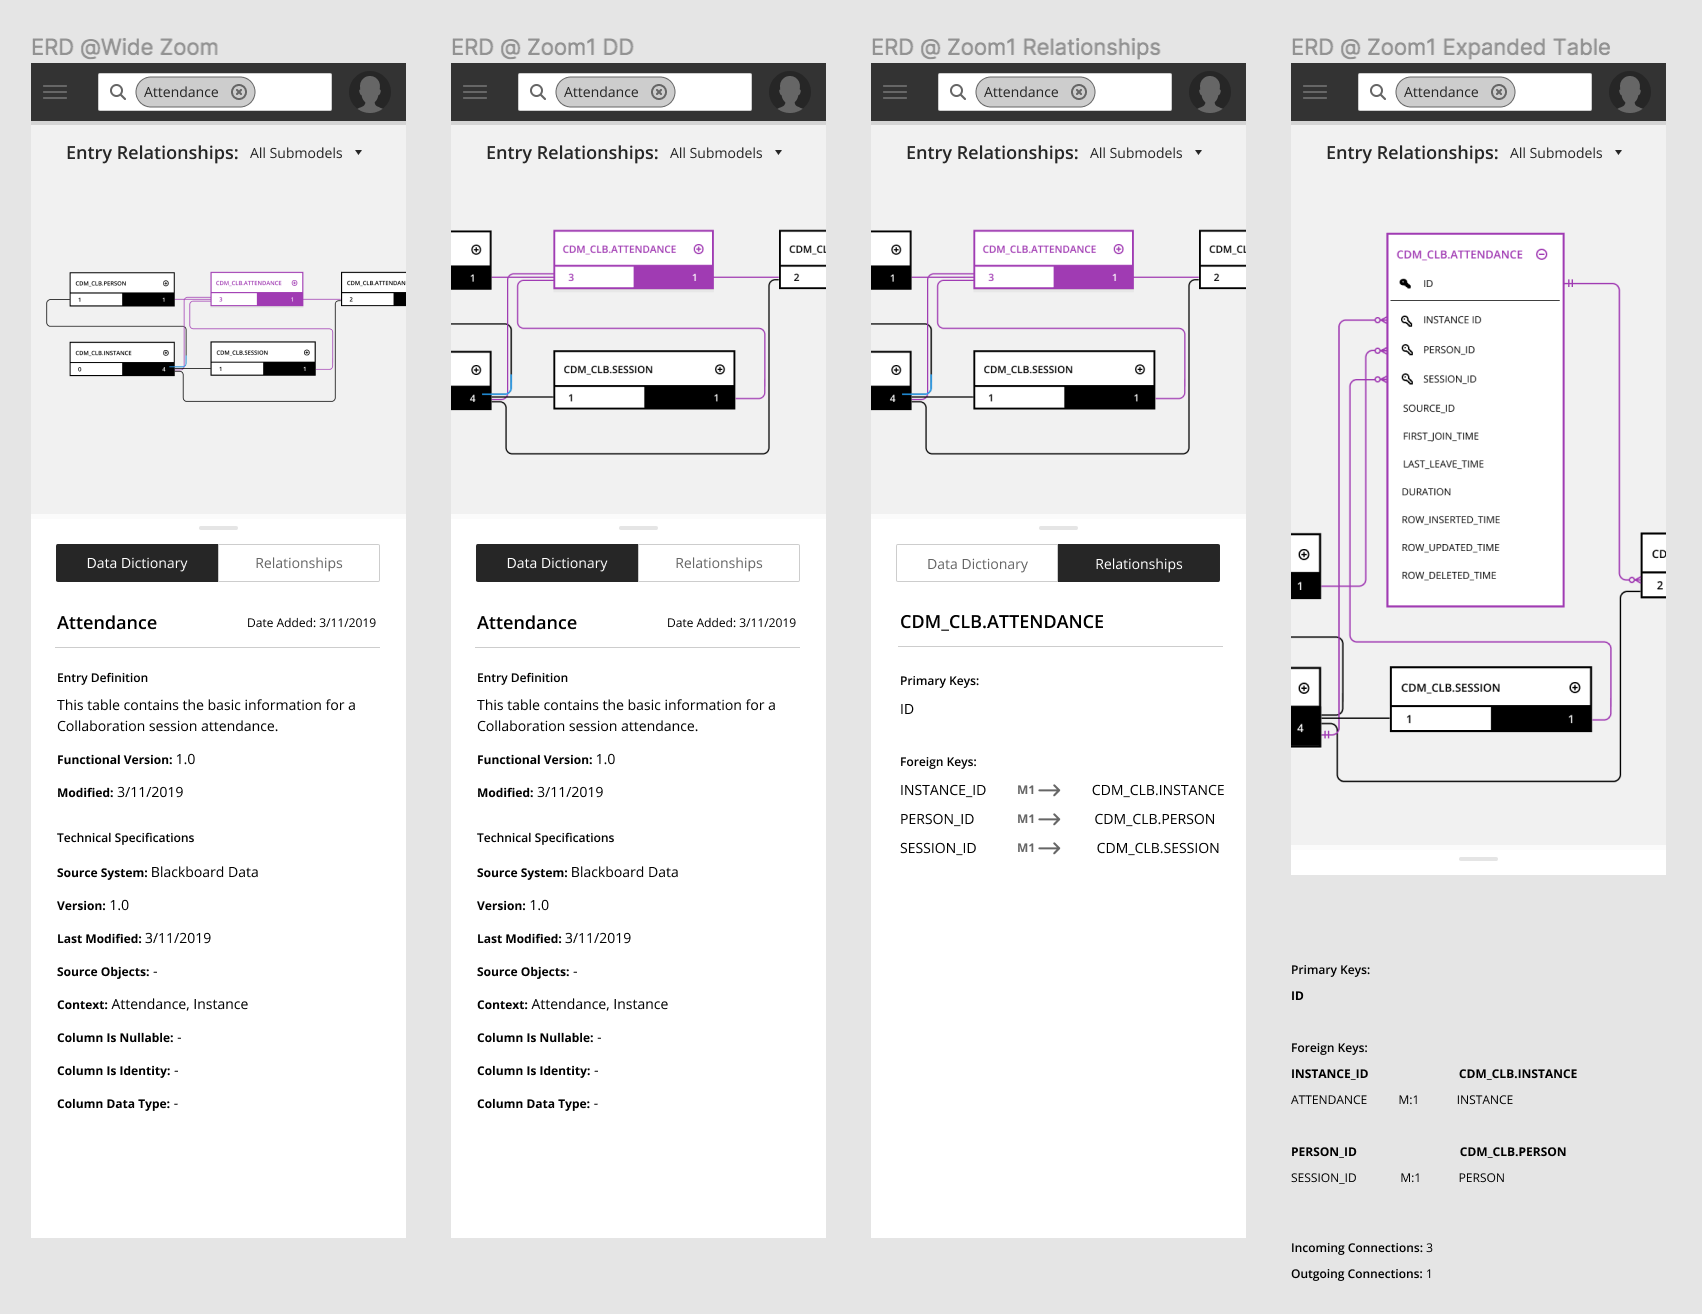
Follow Up Features and Iterations:
Entity Relationship Diagram visualizations provide data-fluent users a way to explore data relations within the canonical data model. Understanding this industry convention as a lay person was both challenging and a fascinating learning experience as we had to work quickly to implement this feature into the existing information architecture. I interviewed multiple data administrators from a range of academic institutions and helped the product team define the shape of our v1 based on user inputs.
The released reporting views have since gone through multiple iterations due to more recent implementation changes and usability testing. In order to do this, we have had to periodically realign on personas through workshop and further research. Once a year, we have run a user story writing workshop for the analytics team to write key user stories for PI planning.
Next Steps:
The next phase in developing Blackboard Data is all about bringing the right data to the right people within their existing LMS workflow. I have been working with project management to prototype this in various ways.
(Early concepts below)